
UNITED STATES
SECURITIES AND EXCHANGE COMMISSION
Washington, D.C. 20549
SECURITIES AND EXCHANGE COMMISSION
Washington, D.C. 20549
FORM 8-K
CURRENT REPORT
Pursuant to Section 13 OR 15(d)
of the Securities Exchange Act of 1934
Pursuant to Section 13 OR 15(d)
of the Securities Exchange Act of 1934
Date of Report (Date of earliest event reported):
(Exact name of registrant as specified in its charter)
(State or other jurisdiction of incorporation) | (Commission File Number) | (IRS Employer Identification No.) | ||||||
(Address of principal executive offices, including zip code)
(917 ) 310-2731
Registrant’s telephone number, including area code
Registrant’s telephone number, including area code
N/A
(Former name or former address, if changed since last report)
(Former name or former address, if changed since last report)
Check the appropriate box below if the Form 8-K filing is intended to simultaneously satisfy the filing obligation of the registrant under any of the following provisions:
Securities registered pursuant to Section 12(b) of the Act:
| Title of each class | Trading Symbol(s) | Name of each exchange on which registered | ||||||
Indicate by check mark whether the registrant is an emerging growth company as defined in Rule 405 of the Securities Act of 1933 (§230.405 of this chapter) or Rule 12b-2 of the Securities Exchange Act of 1934 (§240.12b-2 of this chapter).
Emerging growth company ☒
If an emerging growth company, indicate by check mark if the registrant has elected not to use the extended transition period for complying with any new or revised financial accounting standards provided pursuant to Section 13(a) of the Exchange Act. ☐
Item 2.02. Results of Operations and Financial Condition.
On November 16, 2026, Teamshares Inc. and its subsidiaries (“Teamshares” or the “Company”) issued a press release announcing its financial results for the third quarter ended September 30, 2026. The full text of the press release is attached hereto as Exhibit 99.1 and is incorporated herein by reference.
The information in this Item 2.02 and Exhibit 99.1 shall not be deemed “filed” for purposes of Section 18 of the Exchange Act or otherwise subject to the liabilities of that section, nor shall it be deemed incorporated by reference in any filing under the Securities Act or the Exchange Act, except as expressly set forth by specific reference in such a filing.
Item 5.02. Departure of Directors or Certain Officers; Election of Directors; Appointment of Certain Officers; Compensatory Arrangements of Certain Officers.
On November 12, 2026, Madhuri Kommareddi, Chief Operating Officer, notified the Company of her intention to return to public service and, as such, that she will resign from her role with the Company effective March 31, 2027. The Company’s President, Alexander Eu, remains the principal operating officer of Teamshares. Ms. Kommareddi’s resignation is for personal reasons, including a desire to work in a part-time capacity, and did not arise from any disagreement on any matter relating to the operations, policies, financial results or accounting practices of the Company. The Company thanks Ms. Kommareddi for her years of service to the Company and for her material contributions to the Company’s successes. Ms. Kommareddi intends to serve as an advisor to the Company following her departure from the role. She continues to be subject to a non-compete and non-solicit agreement through June 18, 2028.
Item 7.01. Regulation FD Disclosure.
The Company will hold a conference call on November 16, 2026 at 5:00 p.m. (Eastern Time) to discuss the Company’s financial results for the third quarter and nine months ended September 30, 2026. In addition to the press release, an earnings presentation will be made available on the Investor Relations section of the Company’s website at investors.teamshares.com. A copy of the earnings presentation is furnished as Exhibit 99.2 to this Current Report on Form 8-K and is incorporated herein by reference.
The information in this Item 7.01 and Exhibit 99.2 shall not be deemed “filed” for purposes of Section 18 of the Exchange Act or otherwise subject to the liabilities of that section, nor shall it be deemed incorporated by reference in any filing under the Securities Act or the Exchange Act, except as expressly set forth by specific reference in such a filing.
Item 9.01. Financial Statements and Exhibits.
(d) Exhibits.
The following exhibits relate to Item 2.02 and/or Item 7.01, which shall be deemed to be furnished, and not filed:
| Exhibit No. | Description | |||||||
| 99.1 | ||||||||
| 99.2 | ||||||||
| 104 | Cover Page Interactive Data File (formatted as Inline XBRL) | |||||||
SIGNATURES
Pursuant to the requirements of the Securities Exchange Act of 1934, as amended, the registrant has duly caused this Current Report to be signed on its behalf by the undersigned hereunto duly authorized.
| Date: | November 16, 2026 | Teamshares Inc. | |||||||||
| By: | /s/ Michael Brown | ||||||||||
| Name: Michael Brown | |||||||||||
| Title: Chief Executive Officer | |||||||||||
| (Principal Executive Officer) | |||||||||||
Teamshares Reports 3Q 2026 Results; Remains On-Track to Meet 2026 Outlook
New York, NY – November 16, 2026 – Teamshares (Nasdaq:TMS, the “Company”), a tech-enabled acquiror of high-quality SMEs, announced its financial results for 3Q26 and other business updates.
Key Highlights
3Q26 key results and year-over-year comparisons:
•Revenue was $147.9 million, a $28.7 million or 24% increase.
•Net loss was $9.3 million, a $2.9 million or 45% increase, primarily driven by non-cash gains and losses, including lower gains on disposition of assets.
•Adjusted EBITDA was $4.9 million, a $4.2 million or 614% increase.
•Pro Forma Adjusted EBITDA was $6.0 million, a $5.3 million or 780% increase.
•LTM Net Loss was $48.2 million and LTM Pro Forma Adjusted EBITDA was $23.1 million.
Accelerated growth through acquisitions:
•YTD through 9/30, Teamshares acquired four businesses with net income of $6.3 million and Adjusted EBITDA of $6.8 million during the LTM period preceding each of their respective closings.
•Since 9/30, Teamshares acquired six additional businesses expected to generate $13.2 million in annual Adjusted EBITDA in future periods.
•As of November 16, 2026, Teamshares has signed non-binding LOIs for businesses with over $20 million in estimated annual Adjusted EBITDA.
Strengthened the Company’s capital position:
•In September 2026, Teamshares issued $225.0 million in non-convertible, non-voting preferred stock as non-dilutive capital to fund acquisitions alongside senior debt and seller note financing.
•In October 2026, Teamshares retired its $150.0 million legacy credit facility with cash on hand and the proceeds of a new $130.0 million term loan maturing in 4Q 2030.
•Repaid $27.2 million in debt during 3Q26 and $16.2 million shortly after quarter-end, reducing leverage and interest expense.
Teamshares CEO Michael Brown said, “We recently demonstrated our improved access to capital by issuing preferred equity and refinancing our legacy credit facility, paving the way to ramp acquisition closings. Now we have closed $20 million in Adjusted EBITDA year-to-date and have over $20 million in Adjusted EBITDA under LOI. This quick progress demonstrates the growth engine behind our plans to scale to thousands of great companies long-term as their owners retire.”
Teamshares President Alex Eu added, “Our team has rapidly executed acquisitions while maintaining the same rigorous standards, diligence and integration processes, demonstrating our operational capacity to keep pace with improved capital access. We have an attractive, differentiated model offering a permanent home for great businesses and an institutionalized leadership transition system to mitigate key person risk. The unique technology and operating platform we’ve built allow us to take on more acquisitions and continue to build on what made each business successful.”
1
Teamshares CFO Brian Gaebe said, “The recent financings are just the first steps in our strategy to improve our access to capital and lower its cost. We have meaningfully reduced our blended cost of debt and senior leverage ratios, and intend to capitalize on this momentum by actively pursuing a debt financing process that supports our programmatic growth strategy.”
Business Updates
Acquisitions
•During YTD 3Q26, Teamshares acquired four businesses that generated approximately $6.3 million of net income and $6.8 million of Adjusted EBITDA in the aggregate during the LTM period preceding the respective closings.
•Subsequent to 3Q26, Teamshares acquired an additional six businesses, which are collectively expected to generate $13.2 million in annual Adjusted EBITDA in future periods, based on the most recent LTM financial information reviewed during due diligence prior to closing.
•As of November 16, 2026, Teamshares has executed non-binding letters of intent (LOIs) to acquire additional businesses, which are collectively estimated to generate over $20 million in annual Adjusted EBITDA based on initial due diligence of information provided by the sellers and remain subject to further due diligence prior to closing. The LOIs are mutually non-binding, subject to completion of diligence and other customary closing conditions, the negotiation and execution of definitive agreements, the availability of financing and the satisfaction of applicable closing conditions. There can be no assurance that any of these acquisitions will be completed on the anticipated terms or at all.
Operations
Teamshares continued to deliver significant increases in SME Segment Revenues and EBITDA, driven primarily by acquisitions and organic growth (calculated as period-over-period growth from operating subsidiaries owned within both comparable periods). During 3Q26 compared to the same period in prior year:
•SME Segment Revenue increased $28.7 million, or 24%, primarily driven by acquisitions and organic growth of 3.6% by existing operating subsidiaries. During YTD 3Q26, SME Segment Revenue increased $72.3 million, or 21%, primarily driven by acquisitions and organic growth of 4.0% by existing operating subsidiaries. LTM revenue as of 3Q26 was $543.8 million and LTM Pro Forma Revenue as of 3Q26 was $585.4 million.
•SME Segment EBITDA increased $6.8 million, or 62%, primarily driven by acquisitions and organic growth of 2.3% by existing operating subsidiaries. During YTD 3Q26, SME Segment EBITDA increased $17.0 million, or 57%, primarily driven by acquisitions and organic growth of 3.7% by existing operating subsidiaries.
Growing Operating Leverage
•Teamshares corporate expenses (not allocated to reportable segments and excluding transaction costs and costs directly related to the merger completed in connection with the Company’s public listing), increased 9% relative to a 57% increase in SME Segment EBITDA in the YTD 3Q26 period, reflecting the operating leverage of Teamshares business model. The Company expects to continue to realize the benefits from its tech-enabled capabilities as acquisitions during 4Q26 contribute to SME Segment EBITDA without proportionate increases in corporate expenses.
2
•During 3Q26, the year-over-year increase of $2.3 million in corporate expenses was primarily driven by costs associated with the transition to the Company’s first full quarter subject to public compliance and reporting, as well as costs associated with debt financing options not pursued by the Company.
Financing
During 3Q26, Teamshares completed an issuance of perpetual, non-convertible, non-voting, preferred stock with an aggregate liquidation preference of $225.0 million with gross proceeds of $222.8 million net of an original issue discount.
•The Company intends to combine the preferred equity proceeds with lower-cost, senior acquisition debt financing and seller notes to create an attractive blended cost of capital to fund growth through acquisitions.
•The additional liquidity and subordinated nature of the preferred equity within the Company’s capital structure are expected to enhance Teamshares’ ability to obtain senior debt financing on attractive terms. The terms of the preferred stock do not impose restrictions on the amount or type of indebtedness that the Company or its subsidiaries may incur.
•The preferred stock accrues dividends at 16.0% per annum if paid in cash, stepping down to 14.5% in cash if specified deleveraging and EBITDA thresholds are met. Based on the 16.0% cash rate and the $225 million initial liquidation preference, annual dividends on the preferred stock would be approximately $36.0 million. Teamshares may elect to pay-in-kind at a premium.
Subsequent to 3Q26, Teamshares retired its $150.0 million legacy credit facility using the proceeds of a new $130.0 million term loan, maturing in 4Q 2030 (the “Term Loan”), and cash on hand.
•Addressed a near-term debt maturity, and is expected to lower annual cash interest expense by approximately $5.0 million (based on one-month Secured Overnight Financing Rate (“SOFR”) of 4.0% and principal outstanding at closing) through a reduction in interest rate spread and reduction in principal outstanding.
•Preserved flexibility to refinance or repay the Term Loan at any time, and retains the ability to pursue additional debt financing to fund acquisition growth.
•Amounts outstanding under the Term Loan accrue interest at the one-month SOFR (subject to a 3.0% floor) plus 9.5% per annum, representing a 1.5% reduction in the spread compared to the legacy credit facility.
The Company continued to reduce leverage and interest through the repayment of other debt.
•Repaid $27.2 million in debt during 3Q26 with a weighted average interest rate of 12.8%.
•Subsequent to 3Q26, repaid $16.2 million in mezzanine debt with short-term maturities (excluding the legacy credit facility) with an interest rate of 18%.
•Collectively, the repayment of these instruments is expected to reduce interest expense by $6.5 million annually.
2026 Outlook
2026 full year guidance of Pro Forma Adjusted EBITDA remains unchanged at $60 million inclusive of $40 million or more of expected annual Adjusted EBITDA from acquisitions. Our guidance assumes the successful and timely completion of transactions under LOI.
3
Conference Call
The Company will host a conference call to discuss its results on Monday, November 16, 2026, at 5:00 p.m. ET. Interested parties may access the conference call through a live webcast, which can be accessed via this link or by visiting the Company’s Investor Relations website at https://investors.teamshares.com/. Please join the live webcast or dial in at least 10 minutes before the start of the call. A replay of the event webcast will be available on the Company’s Investor Relations website for one year following the call.
About Teamshares
Teamshares is a tech-enabled acquiror of high-quality businesses, intending to be a permanent home for businesses. Part holdco, part fintech, Teamshares programmatically acquires companies with $0.5 to $5.0 million or more of EBITDA from retiring owners, integrates them with the Teamshares platform, and helps employees earn company stock. Founded in 2019, Teamshares operates subsidiaries with consolidated revenue of over $500 million for the trailing twelve-month period as of September 30, 2026 across over 40 industries and 30 states. For more information, visit https://investors.teamshares.com/.
Forward Looking Statements
This press release contains forward-looking statements within the meaning of Section 27A of
the Securities Act of 1933, as amended, and Section 21E of the Securities Exchange Act
of 1934, as amended. All statements other than statements of historical facts contained in this press release are forward-looking statements, including statements regarding pending
acquisitions, expected interest savings, financing plans and cost of capital. In some cases, forward-looking statements can be identified by terms such as "anticipates," "believes," "estimates," "expects," "intends," "plans," "predicts," "projects," "seeks," "future," "outlook," "prospects," "will," "would," "should," "could," "may," or similar words, but the
absence of these words does not mean that a statement is not forward-looking. These statements are not guarantees of future events or performance, and you should not unduly rely on them as they involve certain risks, uncertainties and assumptions that are difficult to predict and that could cause actual results to differ materially from those contemplated by the forward-looking statements. These risks include, but are not limited to, the following: our ability to maintain the listing of our common stock on Nasdaq; our ability to raise financing in the future and to comply with restrictive covenants related to long-term indebtedness; our limited operating history; our ability to successfully acquire, integrate and grow SMEs and implement our tech-enabled employee ownership platform; our ability to complete the acquisitions contemplated by our non-binding LOIs on the anticipated terms or at all; the accuracy and completeness of unaudited financial information provided by sellers of SMEs we acquire or propose to acquire; our ability to refinance or extend certain of our existing credit facilities and preferred equity instruments; our obligations to pay dividends on our perpetual preferred stock; our ability to realize anticipated reductions in interest expense, including as a result of changes in SOFR; costs and resources of operating as a public company; unfavorable or no analyst research or reports; and those risks and factors described under the caption "Risk Factors" in the Company's definitive proxy statement/prospectus, dated May 27, 2026 (as supplemented), as updated by Part II, Item 1A of the Company’s Quarterly Reports on Form 10-Q for the quarters ended June 30, 2026 and September 30, 2026, and in other subsequent filings made with the Securities and Exchange Commission (“SEC”). Forward-looking statements speak only as of the date of this press release and the Company does not undertake any obligation to update or revise any forward-looking information to reflect changes in assumptions, the occurrence of unanticipated events or otherwise.
4
Non-GAAP Financial Measures
Certain financial information contained in this communication, such as Adjusted EBITDA, Pro Forma Adjusted EBITDA, LTM Pro Forma Adjusted EBITDA, LTM Pro Forma Revenue and Free Cash Flow, have not been prepared in accordance with United States generally accepted accounting principles (“GAAP”). These non-GAAP financial measures are not intended to replace financial measures calculated in accordance with GAAP and are intended to supplement our GAAP results. We believe that using these measures affords a more consistent basis for comparing our results of operations from period to period. The principal limitation of these non-GAAP financial measures is that they exclude significant expenses and income that are required by GAAP to be recorded in financial statements. In addition, they are subject to inherent limitations as they reflect the exercise of judgment by management about which expenses and income are excluded and included in determining these non-GAAP financial measures. The reconciliations to the most directly comparable financial measures calculated in accordance with GAAP, are included in the tables at the end of this press release.
The Company is also providing guidance for certain non-GAAP financial measures, including Pro Forma Adjusted EBITDA. The Company is not providing quantitative reconciliations of these forward-looking non-GAAP measures to the most directly comparable GAAP measures due to the uncertainty and inherent difficulty of predicting certain items that affect GAAP results, including, as applicable, acquisition-related costs, stock-based compensation, changes in fair value of financial instruments, interest expense, depreciation and amortization, tax impacts, and other items that may be material and difficult to forecast. Accordingly, a reconciliation is not available without unreasonable effort. The variability of these items could have a significant impact on the Company’s future GAAP financial results.
Contacts
Investor Relations Contact: Mike Levin, investors@teamshares.com
Press Contact: press@teamshares.com
5
Teamshares Inc.
Summarized Consolidated Statements of Operations
($ in thousands, except per share values)
(Unaudited)
| Three Months Ended September 30, | Nine Months Ended September 30, | ||||||||||||||||||||||||||||||||||||||||||||||
| (in thousands, except for percentages) | 2026 | 2025 | $ Change | % Change | 2026 | 2025 | $ Change | % Change | |||||||||||||||||||||||||||||||||||||||
| Revenue | $ | 147,901 | $ | 119,224 | $ | 28,677 | 24 | % | $ | 417,601 | $ | 345,341 | $ | 72,259 | 21 | % | |||||||||||||||||||||||||||||||
| Cost of Revenue | 89,126 | 73,355 | 15,770 | 21 | % | 249,463 | 211,497 | 37,967 | 18 | % | |||||||||||||||||||||||||||||||||||||
| Gross Profit | 58,776 | 45,869 | 12,907 | 28 | % | 168,137 | 133,845 | 34,293 | 26 | % | |||||||||||||||||||||||||||||||||||||
| Operating Expenses (Income) | |||||||||||||||||||||||||||||||||||||||||||||||
| Depreciation | 785 | 757 | 27 | 4 | % | 2,714 | 2,416 | 298 | 12 | % | |||||||||||||||||||||||||||||||||||||
| Amortization | 1,618 | 1,223 | 395 | 32 | % | 5,041 | 4,105 | 935 | 23 | % | |||||||||||||||||||||||||||||||||||||
| Selling, General, and Administrative Expenses | 58,824 | 47,924 | 10,900 | 23 | % | 167,101 | 141,039 | 26,062 | 18 | % | |||||||||||||||||||||||||||||||||||||
| Goodwill Impairment | 1,116 | 819 | 298 | 36 | % | 1,116 | 7,644 | (6,528) | (85 | %) | |||||||||||||||||||||||||||||||||||||
| Gain on Disposition of Assets | (389) | (6,921) | 6,532 | (94 | %) | (258) | (6,071) | 5,813 | (96 | %) | |||||||||||||||||||||||||||||||||||||
| Total Operating Expenses | 61,954 | 43,802 | 18,152 | 41 | % | 175,715 | 149,134 | 26,581 | 18 | % | |||||||||||||||||||||||||||||||||||||
| Income/(Loss) from Operations | (3,178) | 2,067 | (5,245) | (254 | %) | (7,577) | (15,289) | 7,712 | (50 | %) | |||||||||||||||||||||||||||||||||||||
| Non-Operating Expenses (Income) | |||||||||||||||||||||||||||||||||||||||||||||||
| Interest Expense, Net | 9,331 | 8,367 | 965 | 12 | % | 34,862 | 23,456 | 11,406 | 49 | % | |||||||||||||||||||||||||||||||||||||
| Loss on Extinguishment of Debt | — | 2,722 | (2,722) | (100 | %) | — | 2,722 | (2,722) | (100 | %) | |||||||||||||||||||||||||||||||||||||
| Change in Fair Value of Earnout Shares and Deferred Founder Shares Liabilities | (7,473) | — | (7,473) | N/A | (32,356) | — | (32,356) | N/A | |||||||||||||||||||||||||||||||||||||||
| Change in Fair Value of Forward Purchase Agreement Liability | 2,602 | — | 2,602 | N/A | 7,605 | — | 7,605 | N/A | |||||||||||||||||||||||||||||||||||||||
| Loss on the Conversion of SAFE Notes | — | — | — | N/A | 2,175 | — | 2,175 | N/A | |||||||||||||||||||||||||||||||||||||||
| Change in Fair Value of Warrant Liability | — | (2,877) | 2,877 | (100 | %) | (421) | (3,311) | 2,890 | (87 | %) | |||||||||||||||||||||||||||||||||||||
| Change in Fair Value of Contingent Consideration | 1,342 | 504 | 838 | 166 | % | 2,228 | 764 | 1,464 | 192 | % | |||||||||||||||||||||||||||||||||||||
| Other Non-Operating Expense (Income), Net | (170) | (274) | 104 | (38 | %) | (569) | 1,408 | (1,977) | (140 | %) | |||||||||||||||||||||||||||||||||||||
| Total Non-Operating Expenses (Income) | 5,632 | 8,442 | (2,809) | (33 | %) | 13,524 | 25,039 | (11,515) | (46 | %) | |||||||||||||||||||||||||||||||||||||
| Loss Before Income Taxes | (8,811) | (6,375) | (2,435) | 38 | % | (21,101) | (40,328) | 19,227 | (48 | %) | |||||||||||||||||||||||||||||||||||||
| Income Tax Expense | 493 | 45 | 447 | 983 | % | 1,453 | 336 | 1,117 | 333 | % | |||||||||||||||||||||||||||||||||||||
| Net Loss | $ | (9,303) | $ | (6,421) | $ | (2,883) | 45 | % | $ | (22,554) | $ | (40,664) | $ | 18,110 | (45 | %) | |||||||||||||||||||||||||||||||
| Net Income/(Loss) Attributable to Noncontrolling Interests | 93 | (150) | 243 | (162 | %) | 551 | (226) | 777 | (344 | %) | |||||||||||||||||||||||||||||||||||||
| Net Loss Attributable to Teamshares Inc. | $ | (9,396) | $ | (6,271) | $ | (3,126) | 50 | % | $ | (23,105) | $ | (40,438) | $ | 17,333 | (43 | %) | |||||||||||||||||||||||||||||||
| Perpetual Non-Convertible Preferred Stock Cumulative Dividends and Accretion | (825) | — | (825) | N/A | (825) | — | (825) | N/A | |||||||||||||||||||||||||||||||||||||||
| Rollover Share Adjustments | 10 | 183 | (174) | (95 | %) | 74 | 248 | (174) | (70 | %) | |||||||||||||||||||||||||||||||||||||
| Net Loss Attributable to Common Stockholders | $ | (10,212) | $ | (6,087) | $ | (4,124) | 68 | % | $ | (23,857) | $ | (40,190) | $ | 16,333 | (41 | %) | |||||||||||||||||||||||||||||||
| Basic and Diluted Loss Per Share Attributable to Common Stockholders | $ | (0.14) | $ | (0.12) | $ | (0.02) | 14 | % | $ | (0.41) | $ | (0.82) | $ | 0.41 | (50 | %) | |||||||||||||||||||||||||||||||
6
Teamshares Inc.
Statement of Cash Flows
($ in thousands)
(Unaudited)
| For the Nine Months Ended | |||||||||||
| September 30, 2026 | September 30, 2025 | ||||||||||
| Cash Flows From Operating Activities | |||||||||||
| Net Loss | $ | (22,554) | $ | (40,664) | |||||||
| Adjustments to Reconcile Net Loss to Net Cash Used in Operating Activities: | |||||||||||
| Depreciation and Amortization | 9,464 | 8,325 | |||||||||
| Non-Cash Stock-Based Compensation Expense | 5,056 | 2,999 | |||||||||
| Non-Cash Interest Expense | 10,667 | 1,740 | |||||||||
| Goodwill Impairment | 1,116 | 7,644 | |||||||||
| Gain on Disposition of Assets | (258) | (6,071) | |||||||||
| Loss on Extinguishment of Debt | — | 2,722 | |||||||||
| Loss on the Conversion of SAFE Notes | 2,175 | — | |||||||||
| Change in Fair Value of Earnout Shares and Deferred Founder Shares | (32,356) | — | |||||||||
| Change in Fair Value of Forward Purchase Agreement Liability | 7,605 | — | |||||||||
| Change in Fair Value of Warrant Liability | (421) | (3,311) | |||||||||
| Change in Fair Value of Contingent Consideration, Net of Payments | 1,727 | (117) | |||||||||
| Change in Fair Value of the Former Owner Loan | 600 | — | |||||||||
| Changes in Operating Assets and Liabilities, Net of Acquisitions: | |||||||||||
| Inventory | (5,874) | (4,046) | |||||||||
| Accounts Receivable | (3,820) | (2,082) | |||||||||
| Other Assets | (51) | 180 | |||||||||
| Accounts Payable | 4,909 | (1,265) | |||||||||
| Other Liabilities | 5,165 | 28 | |||||||||
| Net Cash Used in Operating Activities | (16,851) | (33,917) | |||||||||
| Cash Flows From Investing Activities | |||||||||||
| Capital Expenditures | (4,436) | (2,984) | |||||||||
| Business Acquisitions, Net of Cash Received | (24,210) | (10,554) | |||||||||
| Proceeds from Sale Leaseback, Net | — | 31,013 | |||||||||
| Additions to Internally Developed Software | (1,099) | (2,214) | |||||||||
| Other Investing Activity | (187) | — | |||||||||
| Net Cash Provided by (Used in) Investing Activities | (29,931) | 15,261 | |||||||||
| Cash Flows From Financing Activities | |||||||||||
| Borrowings Under Credit Facilities | 3,000 | 3,188 | |||||||||
| Repayments Under Credit Facilities | (37,261) | (19,902) | |||||||||
| Borrowings Under Other Debt Instruments | 5,598 | 16,558 | |||||||||
| Repayments of Other Debt Instruments | (29,143) | (3,579) | |||||||||
| Issuance of SAFE Notes | 3,330 | — | |||||||||
| Proceeds from Issuance of Preferred Stock, Net (converted to Company Common Stock at the Closing) | — | 1,350 | |||||||||
| Forward Purchase Agreement Prepayment | (42,240) | — | |||||||||
| Proceeds from SPAC Merger, Net | 159,487 | — | |||||||||
| Payment of Transaction Costs Directly Attributable to the SPAC Merger | (1,901) | — | |||||||||
| Exercise of Common Stock Options for Cash | 894 | — | |||||||||
| Dividends to Noncontrolling Interests | (1,324) | (979) | |||||||||
| Acquisitions of Noncontrolling Interests | (2,415) | (2,272) | |||||||||
| Payments of Debt Issuance Costs | (1,214) | — | |||||||||
| Proceeds from Issuance of Perpetual Non-Convertible Preferred Stock | 222,750 | — | |||||||||
| Payment of Perpetual Non-Convertible Preferred Stock Issuance Costs | (5,798) | — | |||||||||
| Contingent Consideration Payments | (823) | (525) | |||||||||
| Net Cash Provided by (Used in) Financing Activities | 272,941 | (6,162) | |||||||||
| Effect of Exchange Rate Changes on Cash and Cash Equivalents | (212) | — | |||||||||
7
Teamshares Inc.
Statement of Cash Flows
($ in thousands)
(Unaudited)
| Net Increase (Decrease) in Cash, Cash Equivalents and Restricted Cash | 225,947 | (24,818) | |||||||||
| Cash, Cash Equivalents and Restricted Cash at Beginning of Period | 54,097 | 75,509 | |||||||||
| Cash, Cash Equivalents and Restricted Cash at End of Period | 280,044 | 50,691 | |||||||||
| Supplemental Disclosures of Cash Flow Information: | |||||||||||
| Interest Paid | $ | 25,903 | $ | 21,465 | |||||||
| Income Taxes Paid | $ | 815 | $ | 599 | |||||||
| Supplemental Non-Cash Activity: | |||||||||||
| Debt Assumed to Acquire Operating Subsidiaries | $ | 14,025 | $ | 25,550 | |||||||
| Conversion of Legacy Teamshares Series B Warrants into Legacy Teamshares Common Stock | $ | 2,501 | $ | — | |||||||
| Conversion of SAFE Notes into Company Common Stock and Issuance of Incentive Founder Shares to SAFE Investors | $ | 8,505 | $ | — | |||||||
8
Teamshares Inc.
Consolidated Balance Sheets
($ in thousands)
(Unaudited)
| September 30, 2026 | December 31, 2025 | ||||||||||
| Assets | |||||||||||
| Current Assets | |||||||||||
| Cash and Cash Equivalents | $ | 267,222 | $ | 40,246 | |||||||
| Restricted Cash | 12,400 | 13,426 | |||||||||
| Accounts Receivable, Net | 27,462 | 21,354 | |||||||||
| Inventories | 63,182 | 46,405 | |||||||||
| Prepaid Expenses | 3,988 | 2,870 | |||||||||
| Other Current Assets | 2,509 | 3,052 | |||||||||
| Total Current Assets | 376,763 | 127,352 | |||||||||
| Long-Term Assets | |||||||||||
| Restricted Cash | 422 | 425 | |||||||||
| Property, Plant, and Equipment, Net | 31,148 | 30,043 | |||||||||
| Operating Lease Right of Use Assets, Net | 95,593 | 93,586 | |||||||||
| Goodwill, Net | 258,618 | 244,743 | |||||||||
| Internally Developed Software, Net | 4,901 | 6,769 | |||||||||
| Trade Names, Net | 13,093 | 11,598 | |||||||||
| Other Assets | 18,598 | 13,676 | |||||||||
| Total Long-Term Assets | 422,371 | 400,840 | |||||||||
| Total Assets | $ | 799,135 | $ | 528,193 | |||||||
| Liabilities and Stockholders’ Equity | |||||||||||
| Current Liabilities | |||||||||||
| Accounts Payable | $ | 30,641 | $ | 22,586 | |||||||
| Accrued Expenses | 12,800 | 10,562 | |||||||||
| Deferred Revenue | 12,933 | 10,051 | |||||||||
| Contingent Consideration | 3,570 | 3,151 | |||||||||
| Short-Term Debt and Current Portion of Long-Term Debt | 80,241 | 200,147 | |||||||||
| Current Portion of Operating Lease Obligations | 9,373 | 8,524 | |||||||||
| Other Current Liabilities | 14,607 | 9,893 | |||||||||
| Total Current Liabilities | 164,165 | 264,913 | |||||||||
| Long-Term Liabilities | |||||||||||
| Warrant Liability | — | 2,922 | |||||||||
| Contingent Consideration | 6,821 | 6,044 | |||||||||
| Long-Term Debt, Net | 174,124 | 91,399 | |||||||||
| Long-Term Operating Lease Obligations | 88,547 | 88,144 | |||||||||
| Earnout Shares and Deferred Founder Shares Liabilities | 29,645 | — | |||||||||
| Forward Purchase Agreement Liability | 12,991 | — | |||||||||
| Other Long-Term Liabilities | 6,517 | 8,687 | |||||||||
| Total Long-Term Liabilities | 318,645 | 197,196 | |||||||||
| Total Liabilities | 482,810 | 462,109 | |||||||||
| Redeemable Noncontrolling Interests | 1,599 | 2,451 | |||||||||
| Perpetual Non-Convertible Preferred Stock, $0.0001 par value, 300,000 shares authorized, 225,000 issued and outstanding as of September 30, 2026 (aggregate liquidation preference of $225.0 million); 0 shares authorized, 0 issued and outstanding as of December 31, 2025 | 216,977 | — | |||||||||
| Stockholders’ Equity | |||||||||||
| Common Stock, $0.0001 par value, 450,000,000 shares authorized, 72,416,056 issued and outstanding as of September 30, 2026; 97,899,711 shares authorized, 49,180,937 issued and outstanding as of December 31, 2025 | 7 | 5 | |||||||||
| Additional Paid-In Capital | 388,747 | 327,839 | |||||||||
| Accumulated Deficit | (284,880) | (261,775) | |||||||||
| Accumulated Other Comprehensive Loss | (2,197) | (128) | |||||||||
| Total Stockholders’ Equity | 101,677 | 65,941 | |||||||||
| Noncontrolling Interests | (3,928) | (2,308) | |||||||||
| Total Equity | 97,749 | 63,633 | |||||||||
| Total Liabilities and Stockholders’ Equity | $ | 799,135 | $ | 528,193 | |||||||
9
Teamshares Inc.
Segment Reporting
($ in thousands)
(Unaudited)
| Three Months Ended September 30, | Nine Months Ended September 30, | ||||||||||||||||||||||||||||||||||||||||||||||
| 2026 | 2025 | $ Change | % Change | 2026 | 2025 | $ Change | % Change | ||||||||||||||||||||||||||||||||||||||||
| SME Revenue from External Customers | $ | 147,901 | $ | 119,224 | $ | 28,677 | 24 | % | $ | 417,601 | $ | 345,341 | $ | 72,259 | 21 | % | |||||||||||||||||||||||||||||||
| SME Segment EBITDA | $ | 17,798 | $ | 10,963 | $ | 6,835 | 62 | % | $ | 46,991 | $ | 29,964 | $ | 17,027 | 57 | % | |||||||||||||||||||||||||||||||
10
Teamshares Inc.
Non-GAAP Financial Measures
($ in thousands)
(Unaudited)
Limitations of Non-GAAP Measures and Reconciliations to GAAP
Our non-GAAP financial measures have important limitations and are not intended to be considered in isolation or as a substitute for the most directly comparable GAAP measures. These measures exclude significant expenses and income that are required by GAAP to be reflected in our financial statements and, as a result, may not fully capture the costs of operating our business or the timing of related cash flows. The adjustments we make to arrive at these measures may vary from period to period and involve judgment, which reduces comparability over time and to similarly titled measures presented by other companies. Because of these and other limitations, you should consider our non-GAAP financial measures only in conjunction with, and not as superior to, our GAAP results and the reconciliations presented below.
For all periods presented, the most directly comparable GAAP measure to LTM Pro Forma Revenue is Revenue. The most directly comparable GAAP measure to Adjusted EBITDA, Pro Forma Adjusted EBITDA, and LTM Pro Forma Adjusted EBITDA is Net Income. The most directly comparable GAAP measure to Free Cash Flow is net cash provided by (used in) operating activities. Reconciliations of each non-GAAP measure to the most directly comparable GAAP measure are presented in the tables immediately following this discussion.
Adjusted EBITDA
Adjusted EBITDA represents our consolidated results for the post-acquisition period and is calculated as net income (loss) adjusted to exclude (i) interest expense, net, (ii) income tax expense (benefit), (iii) depreciation and amortization, (iv) certain non-cash items and other amounts that we do not consider indicative of our core operating performance, including share-based compensation, gains or losses on disposition of assets, impairment expense and changes in fair value of financial instruments, (v) costs related to the SPAC Merger that did not meet the criteria for capitalization in accordance with Staff Accounting Bulletin Topic 5.A and ASC 340-10-S99-1; however, these costs significantly impact the comparability of periods, (vi) transaction fees directly attributable to the consummation of certain acquisitions, and (vii) certain non-recurring items that are not indicative of our core business. We believe Adjusted EBITDA is useful in evaluating our ability to generate earnings from our operating base and to compare our performance across periods, particularly where non-cash expenses and other items may vary in timing and amount. This measure has historically been utilized both internally and externally to assess our ability to meet future obligations, reinvestment capacity, and shareholder returns.
Pro Forma Adjusted EBITDA
Pro Forma Adjusted EBITDA represents Adjusted EBITDA plus the pre-acquisition results for businesses acquired during the relevant period, as if such businesses had been owned for the entirety of the period presented.
The pre-acquisition results reflect pro forma financial information prepared in accordance with ASC 805 and presented in the notes to our consolidated financial statements, adjusted to conform to the requirements of Article 11 of Regulation S-X, including the application of appropriate transaction accounting adjustments. The pre-acquisition results included in Pro Forma Adjusted EBITDA are sourced from the historical financial statements of the acquired businesses, adjusted to conform to GAAP. For each acquired business, we identify the applicable pre-acquisition portion of the period(s) presented and extract the relevant EBITDA (or net income with reconciling adjustments) for that pre-acquisition portion. For each acquisition closed during the period, we include the portion of the period presented prior to the acquisition date such that, when combined with the post-acquisition period included in our consolidated results, the acquired business is reflected as if owned for the full period presented. For example, for a business acquired on September 1, we include pre-acquisition results for July 1 through August 31 for the three-month period, and January 1 through August 31 for the nine-month period.
The target’s historical financial results, which are generally unaudited, are subject to our pre-acquisition financial and legal due diligence procedures, which include an assessment of their accounting policies and practices, and, where applicable, a quality of earnings assessment. To promote consistency and comparability, we apply only factually supportable, policy-conforming adjustments to pre-acquisition results, including:
•Conforming classification adjustments to align with our presentation (for example, recalculating and reclassifying depreciation and amortization to match our financial statement line items and EBITDA definition).
•Removal of owner-specific, non-recurring compensation and related-party expenses that do not continue post-acquisition and for which we assume or implement arm’s-length market terms. The cost structure is then burdened with costs related to the placement of a president to replace the retiring owner.
•Elimination of non-recurring transaction costs directly related to the acquisition.
•Standardization of accounting policies where objectively determinable and factually supportable (for example, capitalization thresholds for property and equipment, classification of repairs and maintenance). We do not adjust pre-acquisition results for expected synergies, integration initiatives, or other hypothetical or forward-looking benefits.
11
Teamshares Inc.
Non-GAAP Financial Measures
($ in thousands)
(Unaudited)
Our primary debt agreements define EBITDA-based covenant measures using similar adjustments as the non-GAAP measures presented herein. As a result, the Pro Forma Adjusted EBITDA we present is defined consistently with the EBITDA measure used for covenant compliance under our credit agreements. We are also including this disclosure to enable public investors to understand and assess our compliance with those covenants. We may, from time to time, disclose covenant calculations as required by our agreements; such disclosures are provided for compliance assessment and transparency. In addition, including pre-acquisition results improves the alignment between income statement activity and the balance sheet, as the balance sheet fully reflects the impact of acquisition accounting while the income statement would otherwise present only a partial period of post-acquisition results. Furthermore, we believe Pro Forma Adjusted EBITDA enhances consistency and comparability across periods.
The Company is unable to provide a quantitative reconciliation of its expected future contributions to Adjusted EBITDA of businesses acquired subsequent to the period presented or under LOI to net income, the most directly comparable GAAP measure, without unreasonable effort because certain items that impact net income (loss), including, interest expense under the financing structure used to fund each acquisition, income taxes, depreciation and amortization resulting from purchase price allocation, acquisition-related costs, financing structure, and the timing and magnitude of future acquisitions, cannot be reasonably predicted. These items could be significant and, accordingly, the most directly comparable GAAP measures may differ materially from the non-GAAP amounts presented.
LTM Pro Forma Revenue
LTM Pro Forma Revenue represents consolidated revenue for the trailing-twelve month period plus the pre-acquisition revenue for businesses acquired during the relevant period, as if such businesses had been owned for the entirety of the period presented.
The pre-acquisition revenue of newly acquired companies is calculated in the same method described in Pro Forma Adjusted EBITDA.
Including pre-acquisition results improves the alignment between income statement activity and the balance sheet, as the balance sheet fully reflects the impact of acquisition accounting while the income statement would otherwise present only a partial period of post-acquisition results. We believe LTM Pro Forma Revenue enhances consistency and comparability across periods.
LTM Pro Forma Adjusted EBITDA
LTM Pro Forma Adjusted EBITDA represents Adjusted EBITDA for the trailing-twelve month period plus the pre-acquisition EBITDA for businesses acquired during the relevant period, as if such businesses had been owned for the entirety of the period presented.
The pre-acquisition EBITDA of newly acquired companies is calculated in the same method described in Pro Forma Adjusted EBITDA.
LTM Pro Forma Adjusted EBITDA improves the comparability across periods of Pro Forma Adjusted EBITDA. Additionally, our primary debt agreements mentioned in the Pro Forma Adjusted EBITDA definition generally utilize EBITDA-based covenants on a trailing-twelve month basis. We are also including this disclosure to enable public investors to understand and assess our compliance with those covenants.
Reconciliation of Adjusted EBITDA and Pro Forma Adjusted EBITDA
| For the Three Months Ended | For the Nine Months Ended | ||||||||||||||||||||||
| $ in thousands | September 30, 2026 | September 30, 2025 | September 30, 2026 | September 30, 2025 | |||||||||||||||||||
| Net Loss | $ | (9,303) | $ | (6,421) | $ | (22,554) | $ | (40,664) | |||||||||||||||
| Interest Expense, Net | 9,331 | 8,367 | 34,862 | 23,456 | |||||||||||||||||||
| Income Tax Expense | 493 | 45 | 1,453 | 336 | |||||||||||||||||||
Depreciation1 | 1,557 | 1,398 | 4,418 | 4,220 | |||||||||||||||||||
| Amortization | 1,618 | 1,223 | 5,041 | 4,105 | |||||||||||||||||||
| Goodwill Impairment | 1,116 | 819 | 1,116 | 7,644 | |||||||||||||||||||
| Share-Based Compensation | 3,208 | 1,102 | 5,624 | 3,261 | |||||||||||||||||||
Non-Cash Gains/Losses2 | (4,175) | (6,572) | (21,301) | (5,895) | |||||||||||||||||||
SPAC Merger Transaction Costs3 | 509 | 622 | 2,616 | 622 | |||||||||||||||||||
Acquisition Costs and Other Items Affecting Comparability4 | 515 | 97 | 1,535 | 3,402 | |||||||||||||||||||
| Adjusted EBITDA | $ | 4,868 | $ | 681 | $ | 12,809 | $ | 487 | |||||||||||||||
Pro Forma EBITDA for Acquisitions5 | 1,127 | — | 3,784 | 68 | |||||||||||||||||||
| Pro Forma Adjusted EBITDA | $ | 5,995 | $ | 681 | $ | 16,593 | $ | 554 | |||||||||||||||
12
Teamshares Inc.
Non-GAAP Financial Measures
($ in thousands)
(Unaudited)
1.Includes $0.8 million and $1.7 million of depreciation expense recognized in cost of revenue during the three and nine months ended September 30, 2026, respectively, and $0.6 million and $1.8 million during the three and nine months ended September 30, 2025, respectively.
2.Non-Cash Gains and Losses includes Loss (Gain) on Disposition of Assets, Loss on Extinguishment of Debt, Change in Fair Value of Earnout Shares and Deferred Founder Shares, Change in Fair Value of Forward Purchase Agreement Liability, Loss on the Conversion of SAFE Notes, Change in Fair Value of Warrant Liability, Change in Fair Value of Contingent Consideration, and the change in the fair value of derivatives that are included in Other non-operating income on the Consolidated Statements of Operations.
3.Includes costs incurred during the three and nine months ended September 30, 2026 and 2025 related to the SPAC Merger, which primarily related to legal and accounting fees related to the merger agreement and regulatory matters. These costs did not meet the criteria for capitalization in accordance with Staff Accounting Bulletin Topic 5.A and ASC 340-10-S99-1; however, these costs significantly impact the comparability of periods and are therefore included as an adjustment to calculate Adjusted EBITDA.
4.Includes transaction fees directly attributable to the consummation of certain acquisitions of $0.5 million and $0.1 million during the three months ended September 30, 2026 and 2025, respectively, and $1.0 million and $1.3 million during the nine months ended September 30, 2026 and 2025, respectively. These are direct incremental costs associated with certain acquisitions and exclude any internal costs related to originations, diligence or legal activities, and recurring costs with third-parties associated with evaluating acquisitions. These costs are included in Selling, General, and Administrative Expenses within the Consolidated Statements of Operations. Additionally, this includes a $0.6 million loss on the change in fair value of a financing instrument included in Other Non-Operating Expenses/(Income), Net during the nine months ended September 30, 2026. There were no similar costs during three and nine months ended September 30, 2025. Also, this includes an expense of $2.1 million during the nine months ended September 30, 2025 for the settlement of performance and payment bonds that were issued by an operating subsidiary that ceased operations. There were no similar costs during the three and nine months ended September 30, 2026. The type of business was unique relative to other operating subsidiaries and the Company has never incurred any other similar types of costs. These costs are included in Other Non-Operating Expense (Income), Net within the Consolidated Statements of Operations. These costs were included as an adjustment to calculate Adjusted EBITDA since they are not representative of ongoing operations.
5.Pro Forma EBITDA for Acquisitions represents the pre-acquisition results of operating subsidiaries acquired prior to the end of the respective periods. The amounts were derived from the pro forma financial results prepared in accordance with ASC 805 and presented within the “Business Combinations” footnote to the Company’s interim consolidated financial statements. The adjustments and presentation conform to the requirements of Article 11 of Regulation S-X, including the application of appropriate transaction accounting adjustments. The following table includes further financial information related to the pre-acquisition results of operating subsidiaries acquired prior to the end of the respective periods, which includes four companies acquired during the nine months ended September 30, 2026 and five companies acquired during the year ended December 31, 2025 (there were 4 additional companies acquired during January 2025; however, they are not included in this adjustment as they had a full three and nine months of post-acquisition results during the three and nine months ended September 30, 2025):
| $ in thousands | Three Months Ended September 30, 2026 | Three Months Ended September 30, 2025 | Nine Months Ended September 30, 2026 | Nine Months Ended September 30, 2025 | |||||||||||||||||||
| Revenue | $ | 5,942 | $ | — | $ | 20,878 | $ | 1,280 | |||||||||||||||
| Income from operations | 1,095 | — | 3,563 | (5) | |||||||||||||||||||
| Net Income (Loss) | $ | 1,061 | $ | — | $ | 3,395 | $ | (5) | |||||||||||||||
| Interest Expense | 33 | — | 168 | — | |||||||||||||||||||
| Depreciation and Amortization | 33 | — | 216 | 34 | |||||||||||||||||||
| Loss (Gain) on Disposition of Assets | — | — | 5 | 39 | |||||||||||||||||||
| Pro Forma EBITDA for Acquisitions | $ | 1,127 | $ | — | $ | 3,784 | $ | 68 | |||||||||||||||
During the three and nine months ended September 30, 2026 the post-acquisition results of operating subsidiaries acquired during the period contributed $0.1 million and $1.1 million, respectively, to Adjusted EBITDA. There were no acquisitions completed during the three months ended September 30, 2025. During the nine months ended September 30, 2025 the post-acquisition results of operating subsidiaries acquired during the period contributed $4.6 million.
Reconciliation of LTM Pro Forma Revenue
13
Teamshares Inc.
Non-GAAP Financial Measures
($ in thousands)
(Unaudited)
| $ in thousands | Twelve Months Ended September 30, 2026 | ||||
| Revenue | $ | 543,826 | |||
Pro Forma Revenue for Acquisitions1 | 41,550 | ||||
| LTM Pro Forma Revenue | $ | 585,376 | |||
1.The operating subsidiaries acquired during the twelve months ended September 30, 2026 had pre-acquisition revenue of $41.6 million for the twelve months ended September 30, 2026, which was intended to provide additional perspective on the full-period revenue contribution of recently acquired businesses. See note 5 to the reconciliation of LTM Pro Forma Adjusted EBITDA for more detail about the calculation of the pro forma revenue for acquisitions.
Reconciliation of LTM Pro Forma Adjusted EBITDA
| $ in thousands | Twelve Months Ended September 30, 2026 | ||||
| Net Loss | $ | (48,248) | |||
| Interest Expense, Net | 42,597 | ||||
| Income Tax Expense | 1,679 | ||||
Depreciation1 | 5,871 | ||||
| Amortization | 6,842 | ||||
| Goodwill Impairment | 12,884 | ||||
| Share-Based Compensation | 6,633 | ||||
Non-Cash Gains/Losses2 | (18,655) | ||||
SPAC Merger Transaction Costs3 | 4,468 | ||||
Acquisition Costs and Other Items Affecting Comparability4 | 2,100 | ||||
| Adjusted EBITDA | $ | 16,172 | |||
Pro Forma EBITDA for Acquisitions5 | 6,887 | ||||
| LTM Pro Forma Adjusted EBITDA | $ | 23,059 | |||
1.Includes $2.5 million depreciation expense recognized in cost of revenue during the twelve months ended September 30, 2026.
2.Non-Cash Gains and Losses includes Loss (Gain) on Disposition of Assets, Loss on Extinguishment of Debt, Change in Fair Value of Earnout Shares and Deferred Founder Shares, Change in Fair Value of Forward Purchase Agreement Liability, Loss on the Conversion of SAFE Notes, Change in Fair Value of Warrant Liability, Change in Fair Value of Contingent Consideration, and the change in the fair value of derivatives that are included in Other non-operating income on the Consolidated Statements of Operations.
3.Includes costs incurred during the twelve months ended September 30, 2026 related to the SPAC Merger, which primarily related to legal and accounting fees related to the merger agreement and regulatory matters. These costs did not meet the criteria for capitalization in accordance with Staff Accounting Bulletin Topic 5.A and ASC 340-10-S99-1; however, these costs significantly impact the comparability of periods and are therefore included as an adjustment to calculate Adjusted EBITDA.
4.Includes transaction fees directly attributable to the consummation of certain acquisitions of $1.5 million during the twelve months ended September 30, 2026. These are direct incremental costs associated with certain acquisitions and exclude any internal costs related to originations, diligence or legal activities, and recurring costs with third-parties associated with evaluating acquisitions. These costs are included in Selling, General, and Administrative Expenses within the Consolidated Statements of Operations. Additionally, this includes a $0.6 million loss on the change in fair value of a financing instrument included in Other Non-Operating Expenses/(Income), Net during the twelve months ended September 30, 2026.
5.Pro Forma EBITDA for Acquisitions represents the pre-acquisition results of operating subsidiaries acquired prior to the end of the respective periods. The amounts were derived from the pro forma financial results prepared in accordance with ASC 805 and presented within the “Business Combinations” footnote to the Company’s interim consolidated financial statements. The adjustments and presentation conform to the requirements of Article 11 of Regulation S-X, including the application of appropriate transaction accounting adjustments. The following table includes further financial information related to the pre-acquisition results of operating subsidiaries acquired prior to the end of the period, which includes eight companies acquired during the twelve months ended September 30, 2026:
14
Teamshares Inc.
Non-GAAP Financial Measures
($ in thousands)
(Unaudited)
| $ in thousands | Twelve Months Ended September 30, 2026 | ||||
| Revenue | $ | 41,550 | |||
| Income from operations | 6,277 | ||||
| Net Income (Loss) | $ | 5,339 | |||
| Interest Expense | 938 | ||||
| Depreciation and Amortization | 657 | ||||
| Loss (Gain) on Disposition of Assets | (47) | ||||
| Pro Forma EBITDA for Acquisitions | $ | 6,887 | |||
During the twelve months ended September 30, 2026 the post-acquisition results of operating subsidiaries acquired during the period contributed $14.8 million.
Reconciliation of Free Cash Flow
Free Cash Flow represents net cash used in operating activities less capital expenditures and additions to internally developed software. We believe Free Cash Flow is useful in assessing cash generated by or used in our operations after investment in property and equipment and software. Free Cash Flow does not reflect mandatory debt service, preferred stock dividends or
acquisition spending, and does not represent residual cash available for discretionary expenditures.
| For the Nine Months Ended | |||||||||||
| September 30, 2026 | September 30, 2025 | ||||||||||
| Net Cash Used in Operating Activities | $ | (16,851) | $ | (33,917) | |||||||
| Capital Expenditures | (4,436) | (2,984) | |||||||||
| Additions to Internally Developed Software | (1,099) | (2,214) | |||||||||
| Free Cash Flow | $ | (22,386) | $ | (39,115) | |||||||
15

1 3Q 2026 Earnings A permanent home for great businesses when owners retire NASDAQ:TMS
2 Forward Looking Statements This presentation contains forward-looking statements within the meaning of Section 27A of the Securities Act of 1933, as amended, and Section 21E of the Securities Exchange Act of 1934, as amended. All statements other than statements of historical facts contained in this presentation are forward-looking statements, including statements regarding pending acquisitions, expected interest savings, financing plans and cost of capital. In some cases, forward-looking statements can be identified by terms such as "anticipates," "believes," "estimates," "expects," "intends," "plans," "predicts," "projects," "seeks," "future," "outlook," "prospects," "will," "would," "should," "could," "may," or similar words, but the absence of these words does not mean that a statement is not forward-looking. These statements are not guarantees of future events or performance, and you should not unduly rely on them as they involve certain risks, uncertainties and assumptions that are difficult to predict and that could cause actual results to differ materially from those contemplated by the forward-looking statements. These risks include, but are not limited to, the following: our ability to maintain the listing of our common stock on Nasdaq; our ability to raise financing in the future and to comply with restrictive covenants related to long-term indebtedness; our limited operating history; our ability to successfully acquire, integrate and grow SMEs and implement our tech-enabled employee ownership platform; our ability to complete the acquisitions contemplated by our non-binding LOIs on the anticipated terms or at all; the accuracy and completeness of unaudited financial information provided by sellers of SMEs we acquire or propose to acquire; our ability to refinance or extend certain of our existing credit facilities and preferred equity instruments; our obligations to pay dividends on our perpetual preferred stock; our ability to realize anticipated reductions in interest expense, including as a result of changes in SOFR; costs and resources of operating as a public company; unfavorable or no analyst research or reports; and those risks and factors described under the caption "Risk Factors" in the Company's definitive proxy statement/prospectus, dated May 27, 2026 (as supplemented), as updated by Part II, Item 1A of the Company’s Quarterly Reports on Form 10-Q for the quarters ended June 30, 2026 and September 30, 2026, and in other subsequent filings made with the Securities and Exchange Commission (“SEC”). Forward-looking statements speak only as of the date of this presentation and the Company does not undertake any obligation to update or revise any forward-looking information to reflect changes in assumptions, the occurrence of unanticipated events or otherwise. Financial Information; Non-GAAP Financial Measures Certain financial information contained in this presentation, such as Adjusted EBITDA, Pro Forma Adjusted EBITDA, LTM Pro Forma Adjusted EBITDA, and LTM Pro Forma Revenue, have not been prepared in accordance with United States generally accepted accounting principles (“GAAP”). These non-GAAP financial measures are not intended to replace financial measures calculated in accordance with GAAP and are intended to supplement our GAAP results. We believe that using these measures affords a more consistent basis for comparing our results of operations from period to period. The principal limitation of these non-GAAP financial measures is that they exclude significant expenses and income that are required by GAAP to be recorded in financial statements. In addition, they are subject to inherent limitations as they reflect the exercise of judgment by management about which expenses and income are excluded and included in determining these non-GAAP financial measures. The reconciliations to the most directly comparable financial measures calculated in accordance with GAAP, are included in the tables at the end of this presentation. Use of Projections This presentation contains projected financial information with respect to the Company. The projected financial information constitutes forward-looking information, is for illustrative purposes only and should not be relied upon as necessarily being indicative of future results. The assumptions and estimates underlying such financial forecast information are inherently uncertain and are subject to a wide variety of significant business, economic, competitive and other risks and uncertainties. See “Forward-Looking Statements” above. Actual results may differ materially from the results contemplated by the financial forecast information contained in this presentation, and the inclusion of such information in this presentation should not be regarded as a representation by any person that the results reflected in such forecasts will be achieved. Disclaimer

3 Teamshares is a tech- enabled acquiror of SMEs + a permanent home for great businesses Part holdco. Part fintech. We programmatically acquire companies with $0.5 to 5+ million in EBITDA from retiring owners, integrate them with the Teamshares platform, and help employees earn company stock
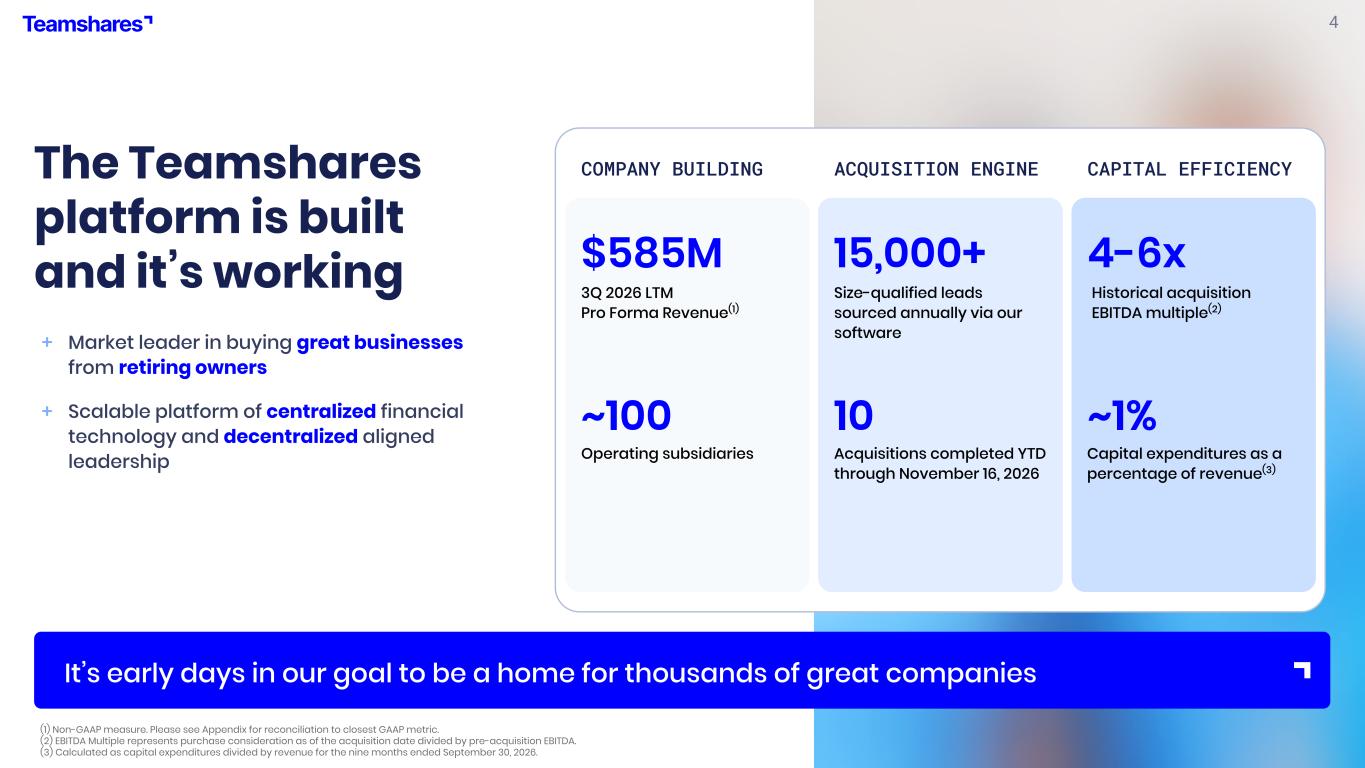
4 (1) Non-GAAP measure. Please see Appendix for reconciliation to closest GAAP metric. (2) EBITDA Multiple represents purchase consideration as of the acquisition date divided by pre-acquisition EBITDA. (3) Calculated as capital expenditures divided by revenue for the nine months ended September 30, 2026. The Teamshares platform is built and it’s working + Market leader in buying great businesses from retiring owners + Scalable platform of centralized financial technology and decentralized aligned leadership ACQUISITION ENGINE $585M ~100 15,000+ 10 COMPANY BUILDING CAPITAL EFFICIENCY 4-6x ~1% Size-qualified leads sourced annually via our software It’s early days in our goal to be a home for thousands of great companies Operating subsidiaries Acquisitions completed YTD through November 16, 2026 Historical acquisition EBITDA multiple(2) 3Q 2026 LTM Pro Forma Revenue(1) Capital expenditures as a percentage of revenue(3)
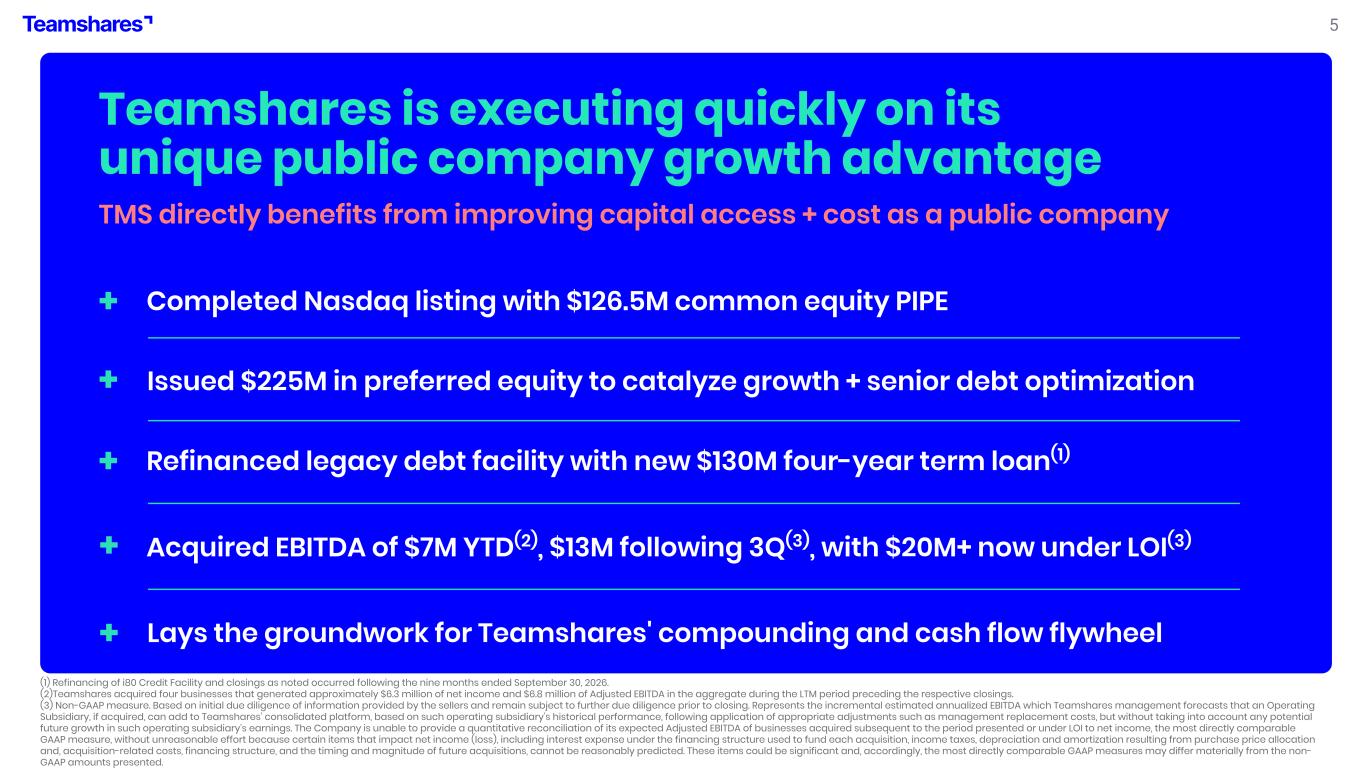
5 Teamshares is executing quickly on its unique public company growth advantage + + Acquired EBITDA of $7M YTD(2), $13M following 3Q(3), with $20M+ now under LOI(3) + Refinanced legacy debt facility with new $130M four-year term loan(1) + Issued $225M in preferred equity to catalyze growth + senior debt optimization + Lays the groundwork for Teamshares' compounding and cash flow flywheel Completed Nasdaq listing with $126.5M common equity PIPE (1) Refinancing of i80 Credit Facility and closings as noted occurred following the nine months ended September 30, 2026. (2)Teamshares acquired four businesses that generated approximately $6.3 million of net income and $6.8 million of Adjusted EBITDA in the aggregate during the LTM period preceding the respective closings. (3) Non-GAAP measure. Based on initial due diligence of information provided by the sellers and remain subject to further due diligence prior to closing. Represents the incremental estimated annualized EBITDA which Teamshares management forecasts that an Operating Subsidiary, if acquired, can add to Teamshares’ consolidated platform, based on such operating subsidiary’s historical performance, following application of appropriate adjustments such as management replacement costs, but without taking into account any potential future growth in such operating subsidiary’s earnings. The Company is unable to provide a quantitative reconciliation of its expected Adjusted EBITDA of businesses acquired subsequent to the period presented or under LOI to net income, the most directly comparable GAAP measure, without unreasonable effort because certain items that impact net income (loss), including interest expense under the financing structure used to fund each acquisition, income taxes, depreciation and amortization resulting from purchase price allocation and, acquisition-related costs, financing structure, and the timing and magnitude of future acquisitions, cannot be reasonably predicted. These items could be significant and, accordingly, the most directly comparable GAAP measures may differ materially from the non- GAAP amounts presented. TMS directly benefits from improving capital access + cost as a public company
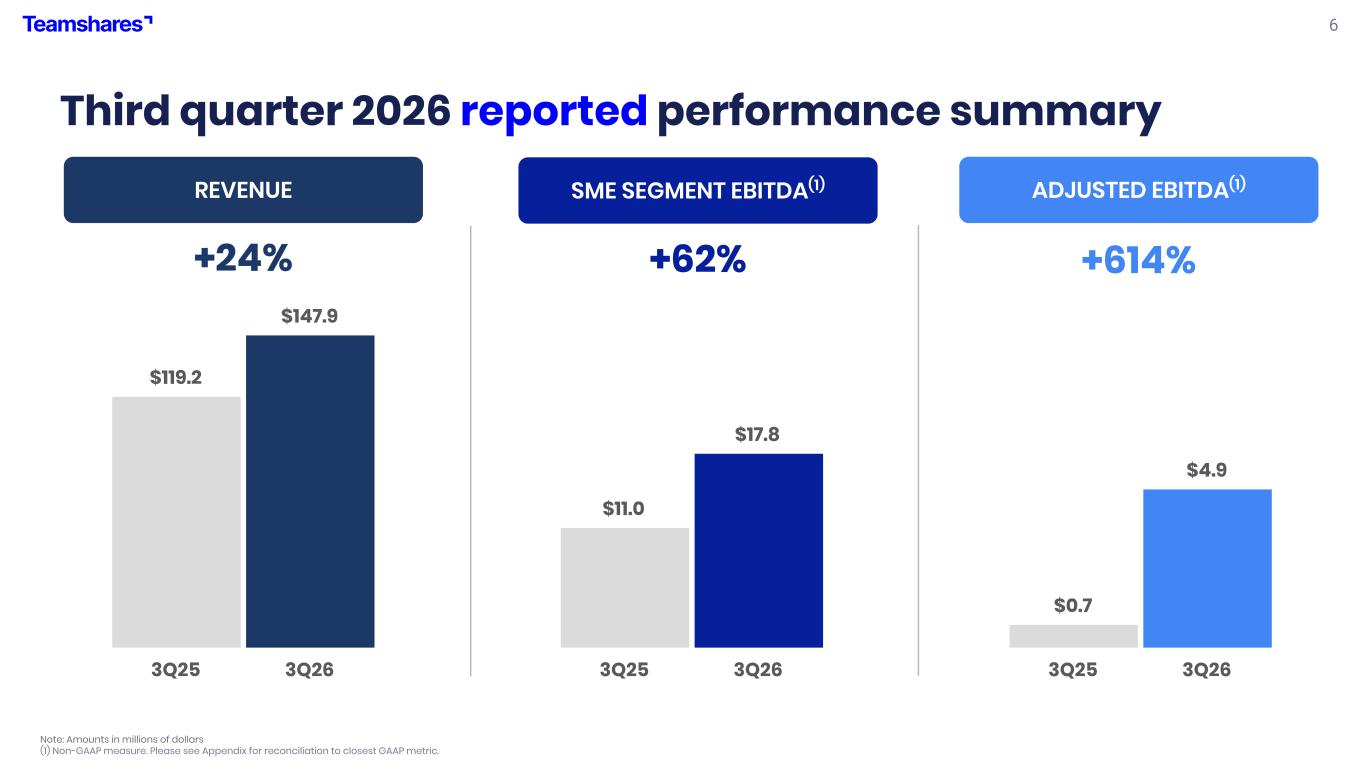
6 Third quarter 2026 reported performance summary Note: Amounts in millions of dollars (1) Non-GAAP measure. Please see Appendix for reconciliation to closest GAAP metric. REVENUE ADJUSTED EBITDA(1)SME SEGMENT EBITDA(1) +24% +62% +614% $119.2 $147.9 3Q25 3Q26 $11.0 $17.8 3Q25 3Q26 $0.7 $4.9 3Q25 3Q26
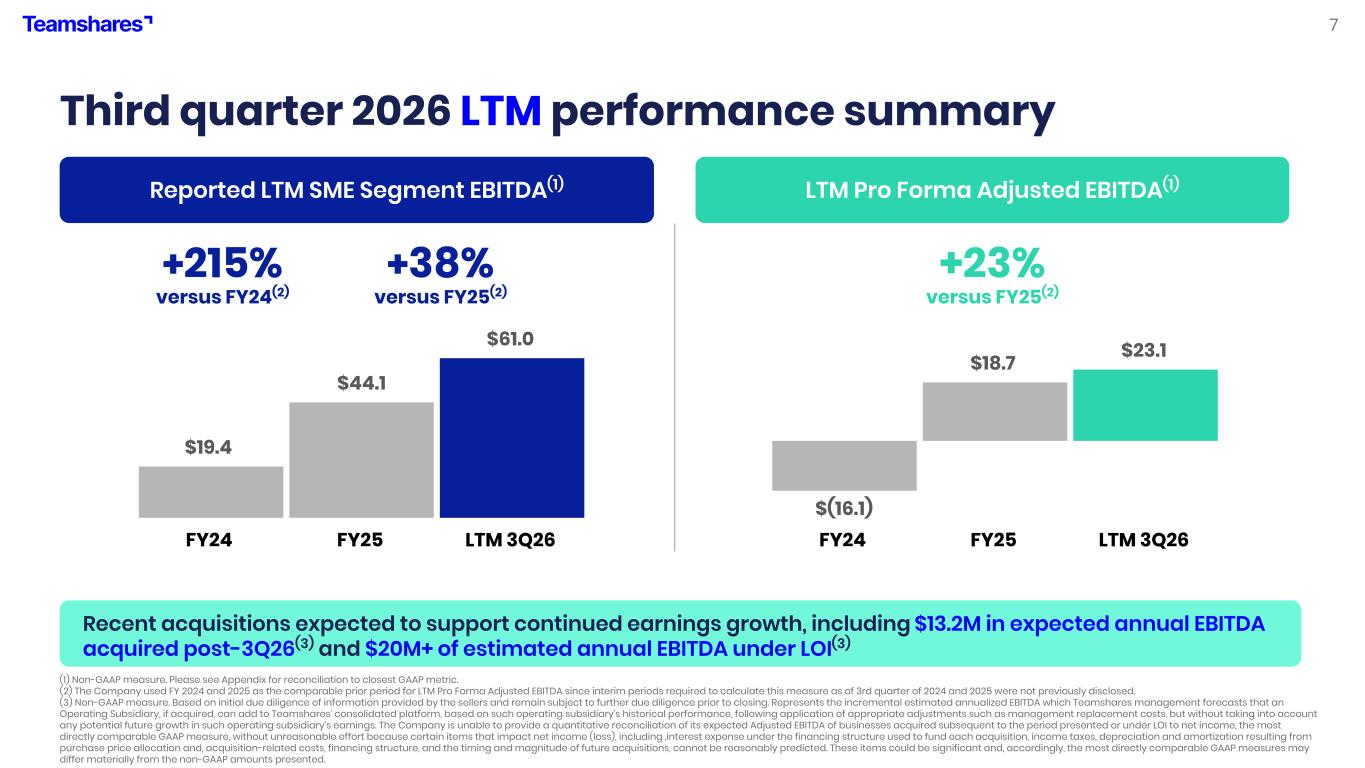
7 Third quarter 2026 LTM performance summary Reported LTM SME Segment EBITDA(1) LTM Pro Forma Adjusted EBITDA(1) +215% versus FY24(2) +23% versus FY25(2) $19.4 $44.1 $61.0 FY24 FY25 LTM 3Q26 $(16.1) $18.7 $23.1 FY24 FY25 LTM 3Q26 (1) Non-GAAP measure. Please see Appendix for reconciliation to closest GAAP metric. (2) The Company used FY 2024 and 2025 as the comparable prior period for LTM Pro Forma Adjusted EBITDA since interim periods required to calculate this measure as of 3rd quarter of 2024 and 2025 were not previously disclosed. (3) Non-GAAP measure. Based on initial due diligence of information provided by the sellers and remain subject to further due diligence prior to closing. Represents the incremental estimated annualized EBITDA which Teamshares management forecasts that an Operating Subsidiary, if acquired, can add to Teamshares’ consolidated platform, based on such operating subsidiary’s historical performance, following application of appropriate adjustments such as management replacement costs, but without taking into account any potential future growth in such operating subsidiary’s earnings. The Company is unable to provide a quantitative reconciliation of its expected Adjusted EBITDA of businesses acquired subsequent to the period presented or under LOI to net income, the most directly comparable GAAP measure, without unreasonable effort because certain items that impact net income (loss), including ,interest expense under the financing structure used to fund each acquisition, income taxes, depreciation and amortization resulting from purchase price allocation and, acquisition-related costs, financing structure, and the timing and magnitude of future acquisitions, cannot be reasonably predicted. These items could be significant and, accordingly, the most directly comparable GAAP measures may differ materially from the non-GAAP amounts presented. +38% versus FY25(2) Recent acquisitions expected to support continued earnings growth, including $13.2M in expected annual EBITDA acquired post-3Q26(3) and $20M+ of estimated annual EBITDA under LOI(3)
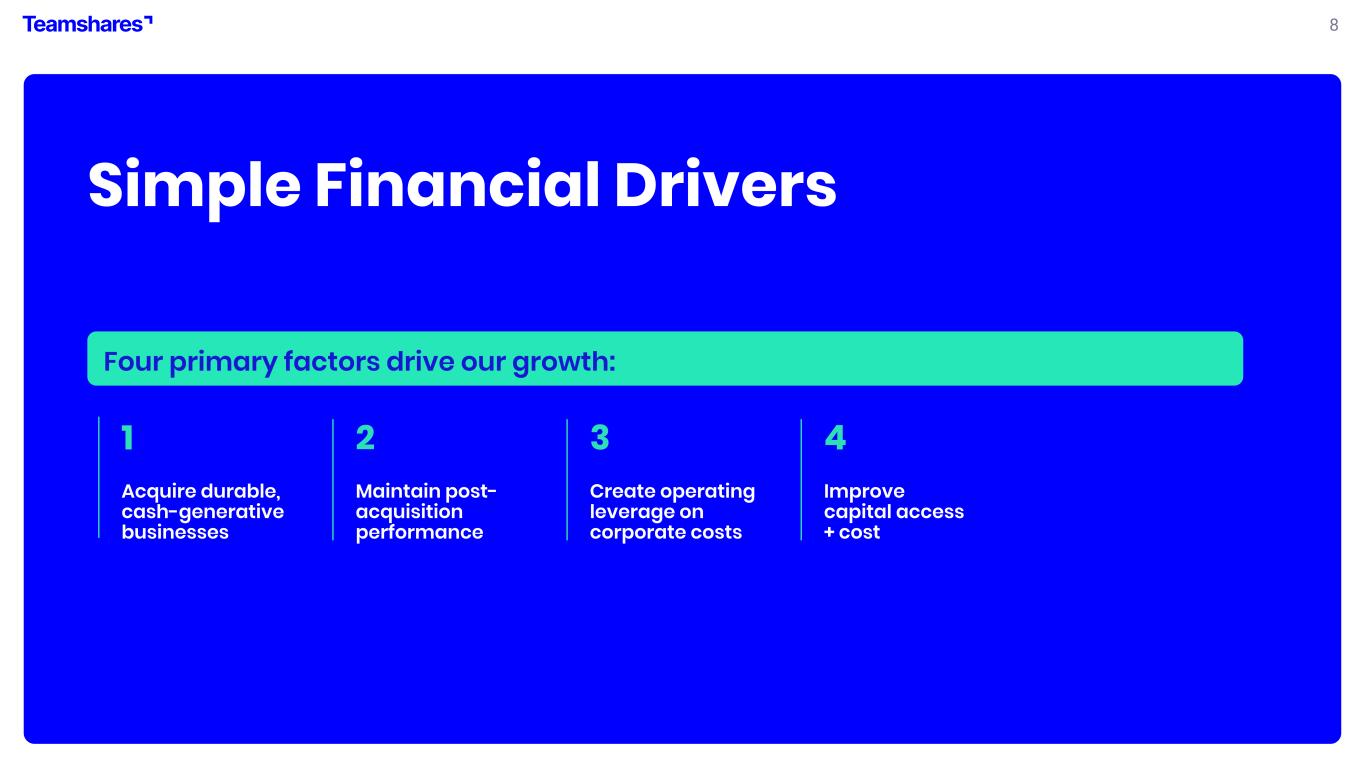
8 Simple Financial Drivers 1 Acquire durable, cash-generative businesses 2 Maintain post- acquisition performance 3 4 Improve capital access + cost Four primary factors drive our growth: Create operating leverage on corporate costs
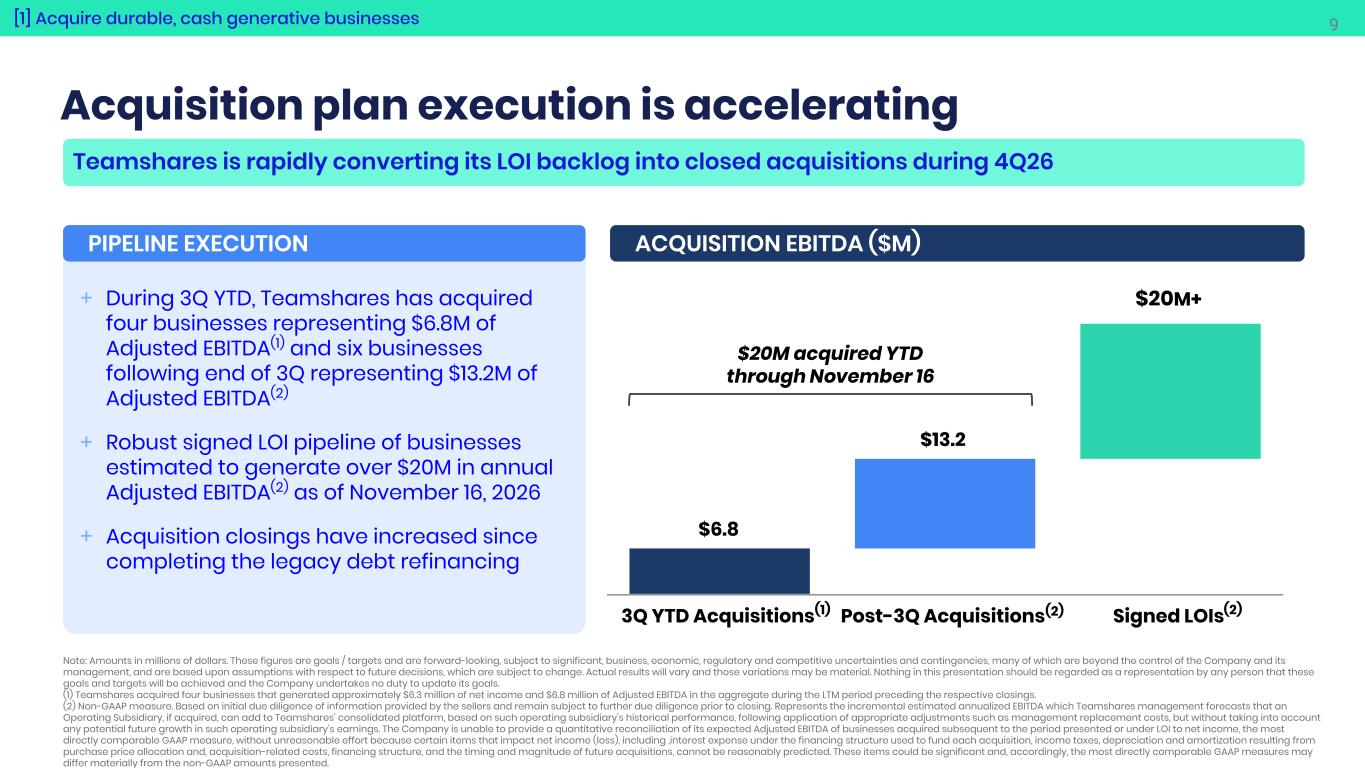
9 Acquisition plan execution is accelerating Note: Amounts in millions of dollars. These figures are goals / targets and are forward-looking, subject to significant, business, economic, regulatory and competitive uncertainties and contingencies, many of which are beyond the control of the Company and its management, and are based upon assumptions with respect to future decisions, which are subject to change. Actual results will vary and those variations may be material. Nothing in this presentation should be regarded as a representation by any person that these goals and targets will be achieved and the Company undertakes no duty to update its goals. (1) Teamshares acquired four businesses that generated approximately $6.3 million of net income and $6.8 million of Adjusted EBITDA in the aggregate during the LTM period preceding the respective closings. (2) Non-GAAP measure. Based on initial due diligence of information provided by the sellers and remain subject to further due diligence prior to closing. Represents the incremental estimated annualized EBITDA which Teamshares management forecasts that an Operating Subsidiary, if acquired, can add to Teamshares’ consolidated platform, based on such operating subsidiary’s historical performance, following application of appropriate adjustments such as management replacement costs, but without taking into account any potential future growth in such operating subsidiary’s earnings. The Company is unable to provide a quantitative reconciliation of its expected Adjusted EBITDA of businesses acquired subsequent to the period presented or under LOI to net income, the most directly comparable GAAP measure, without unreasonable effort because certain items that impact net income (loss), including ,interest expense under the financing structure used to fund each acquisition, income taxes, depreciation and amortization resulting from purchase price allocation and, acquisition-related costs, financing structure, and the timing and magnitude of future acquisitions, cannot be reasonably predicted. These items could be significant and, accordingly, the most directly comparable GAAP measures may differ materially from the non-GAAP amounts presented. $6.8 $13.2 3Q YTD Acquisitions Post-3Q Acquisitions Signed LOIs(1) (2) (2) + During 3Q YTD, Teamshares has acquired four businesses representing $6.8M of Adjusted EBITDA(1) and six businesses following end of 3Q representing $13.2M of Adjusted EBITDA(2) + Robust signed LOI pipeline of businesses estimated to generate over $20M in annual Adjusted EBITDA(2) as of November 16, 2026 + Acquisition closings have increased since completing the legacy debt refinancing $20M acquired YTD through November 16 Teamshares is rapidly converting its LOI backlog into closed acquisitions during 4Q26 [1] Acquire durable, cash generative businesses ACQUISITION EBITDA ($M) $20M+ PIPELINE EXECUTION
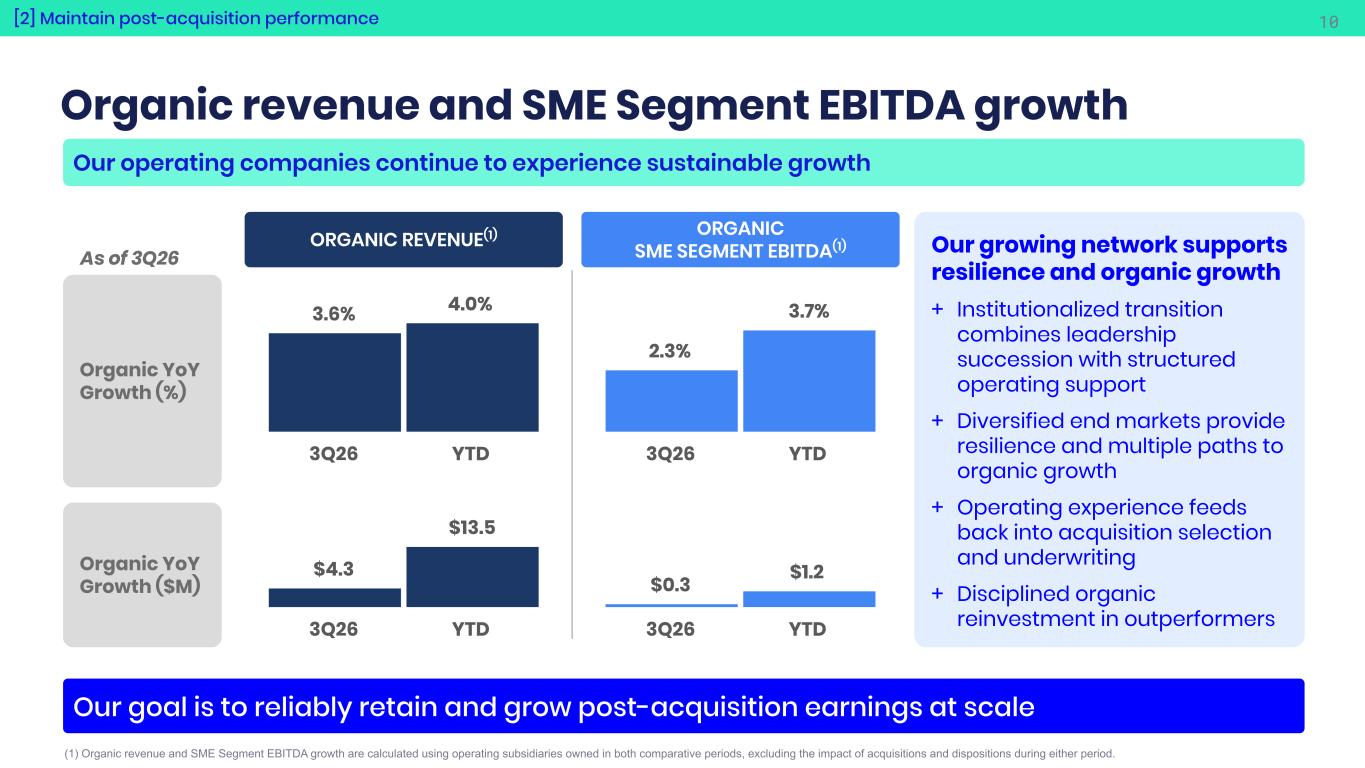
10 Organic revenue and SME Segment EBITDA growth (1) Organic revenue and SME Segment EBITDA growth are calculated using operating subsidiaries owned in both comparative periods, excluding the impact of acquisitions and dispositions during either period. Our goal is to reliably retain and grow post-acquisition earnings at scale [2] Maintain post-acquisition performance ORGANIC REVENUE(1) Our growing network supports resilience and organic growth + Institutionalized transition combines leadership succession with structured operating support + Diversified end markets provide resilience and multiple paths to organic growth + Operating experience feeds back into acquisition selection and underwriting + Disciplined organic reinvestment in outperformers ORGANIC SME SEGMENT EBITDA(1) Our operating companies continue to experience sustainable growth 3.6% 4.0% 3Q26 YTD 2.3% 3.7% 3Q26 YTD Organic YoY Growth (%) Organic YoY Growth ($M) $4.3 $13.5 3Q26 YTD $0.3 $1.2 3Q26 YTD As of 3Q26
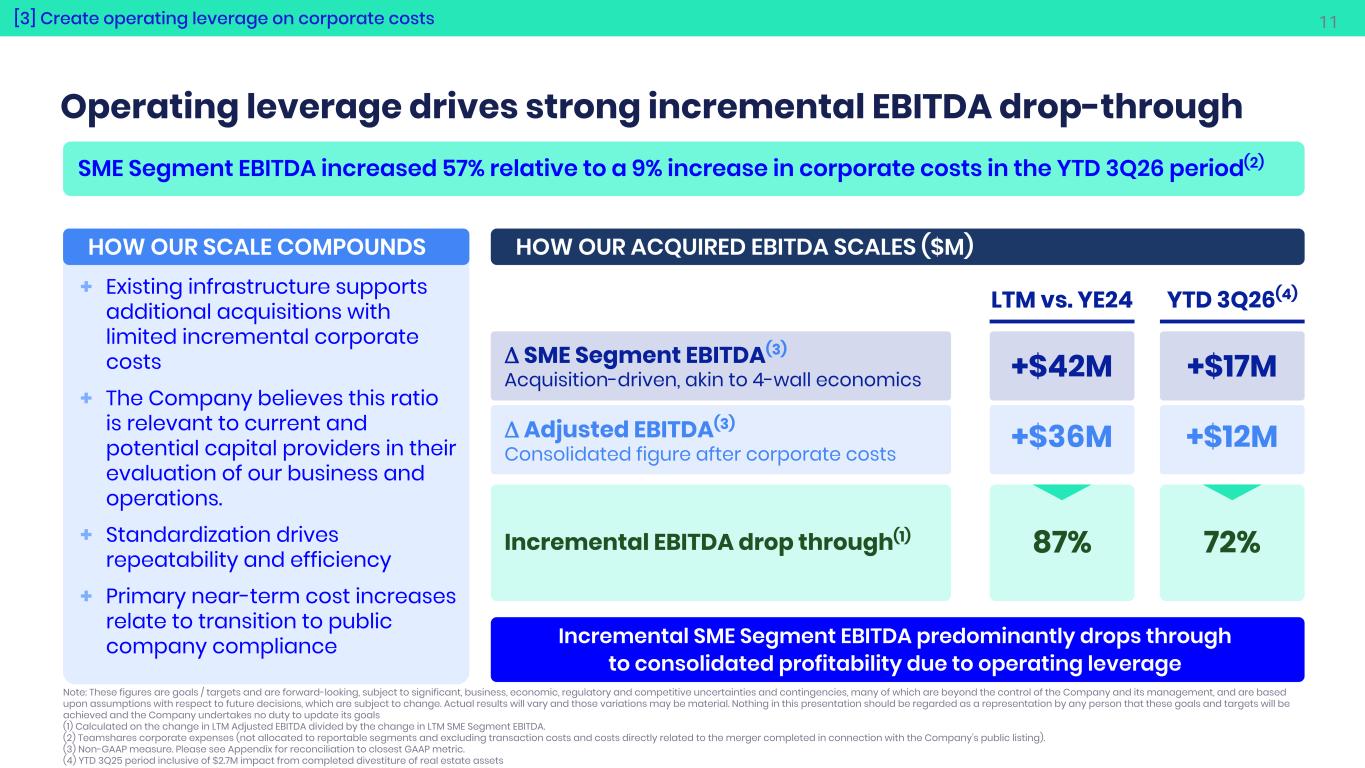
11 + Existing infrastructure supports additional acquisitions with limited incremental corporate costs + The Company believes this ratio is relevant to current and potential capital providers in their evaluation of our business and operations. + Standardization drives repeatability and efficiency + Primary near-term cost increases relate to transition to public company compliance Note: These figures are goals / targets and are forward-looking, subject to significant, business, economic, regulatory and competitive uncertainties and contingencies, many of which are beyond the control of the Company and its management, and are based upon assumptions with respect to future decisions, which are subject to change. Actual results will vary and those variations may be material. Nothing in this presentation should be regarded as a representation by any person that these goals and targets will be achieved and the Company undertakes no duty to update its goals (1) Calculated on the change in LTM Adjusted EBITDA divided by the change in LTM SME Segment EBITDA. (2) Teamshares corporate expenses (not allocated to reportable segments and excluding transaction costs and costs directly related to the merger completed in connection with the Company’s public listing). (3) Non-GAAP measure. Please see Appendix for reconciliation to closest GAAP metric. (4) YTD 3Q25 period inclusive of $2.7M impact from completed divestiture of real estate assets Operating leverage drives strong incremental EBITDA drop-through [3] Create operating leverage on corporate costs HOW OUR ACQUIRED EBITDA SCALES ($M)HOW OUR SCALE COMPOUNDS SME Segment EBITDA increased 57% relative to a 9% increase in corporate costs in the YTD 3Q26 period(2) Δ SME Segment EBITDA(3) Acquisition-driven, akin to 4-wall economics 87% +$36M +$42M Δ Adjusted EBITDA(3) Consolidated figure after corporate costs LTM vs. YE24 Incremental EBITDA drop through(1) YTD 3Q26(4) 72% +$12M +$17M Incremental SME Segment EBITDA predominantly drops through to consolidated profitability due to operating leverage
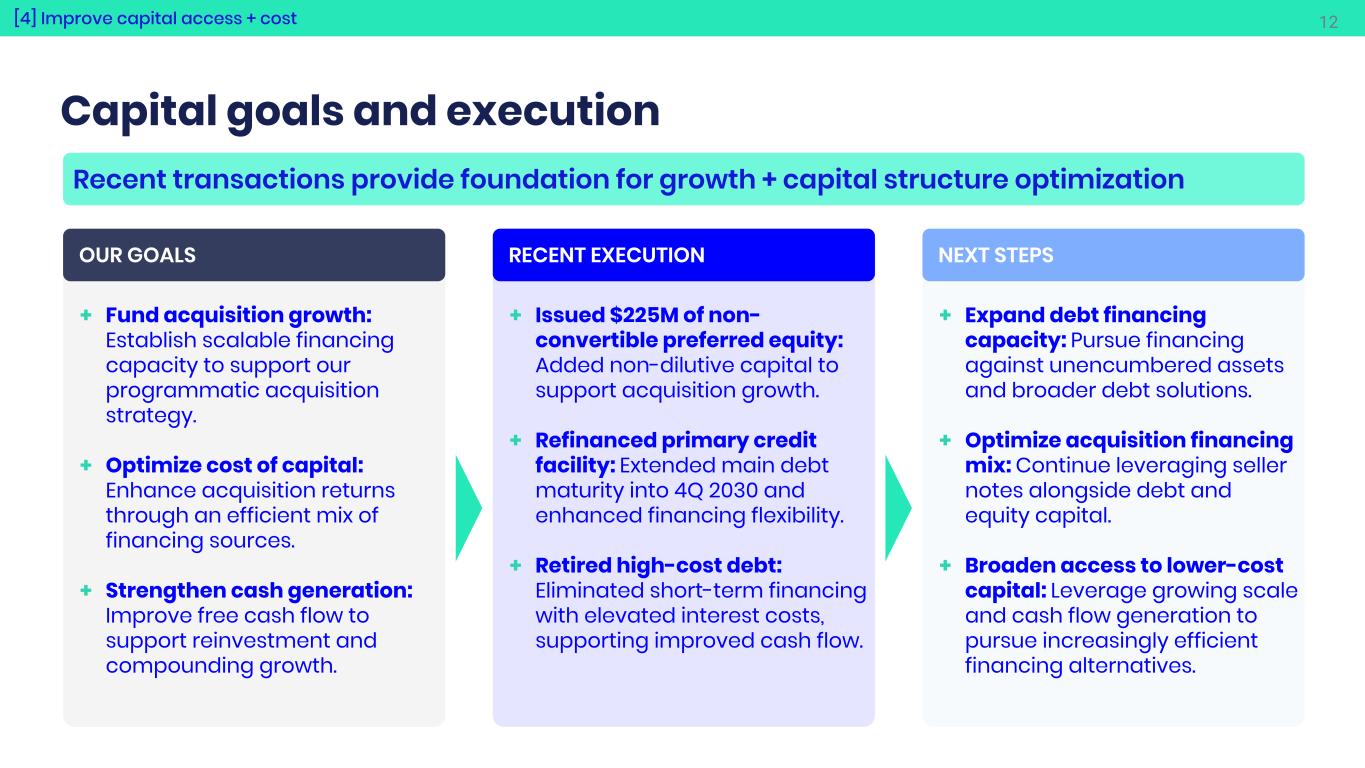
12 + Fund acquisition growth: Establish scalable financing capacity to support our programmatic acquisition strategy. + Optimize cost of capital: Enhance acquisition returns through an efficient mix of financing sources. + Strengthen cash generation: Improve free cash flow to support reinvestment and compounding growth. + Issued $225M of non- convertible preferred equity: Added non-dilutive capital to support acquisition growth. + Refinanced primary credit facility: Extended main debt maturity into 4Q 2030 and enhanced financing flexibility. + Retired high-cost debt: Eliminated short-term financing with elevated interest costs, supporting improved cash flow. + Expand debt financing capacity: Pursue financing against unencumbered assets and broader debt solutions. + Optimize acquisition financing mix: Continue leveraging seller notes alongside debt and equity capital. + Broaden access to lower-cost capital: Leverage growing scale and cash flow generation to pursue increasingly efficient financing alternatives. Capital goals and execution Recent transactions provide foundation for growth + capital structure optimization [4] Improve capital access + cost OUR GOALS RECENT EXECUTION NEXT STEPS
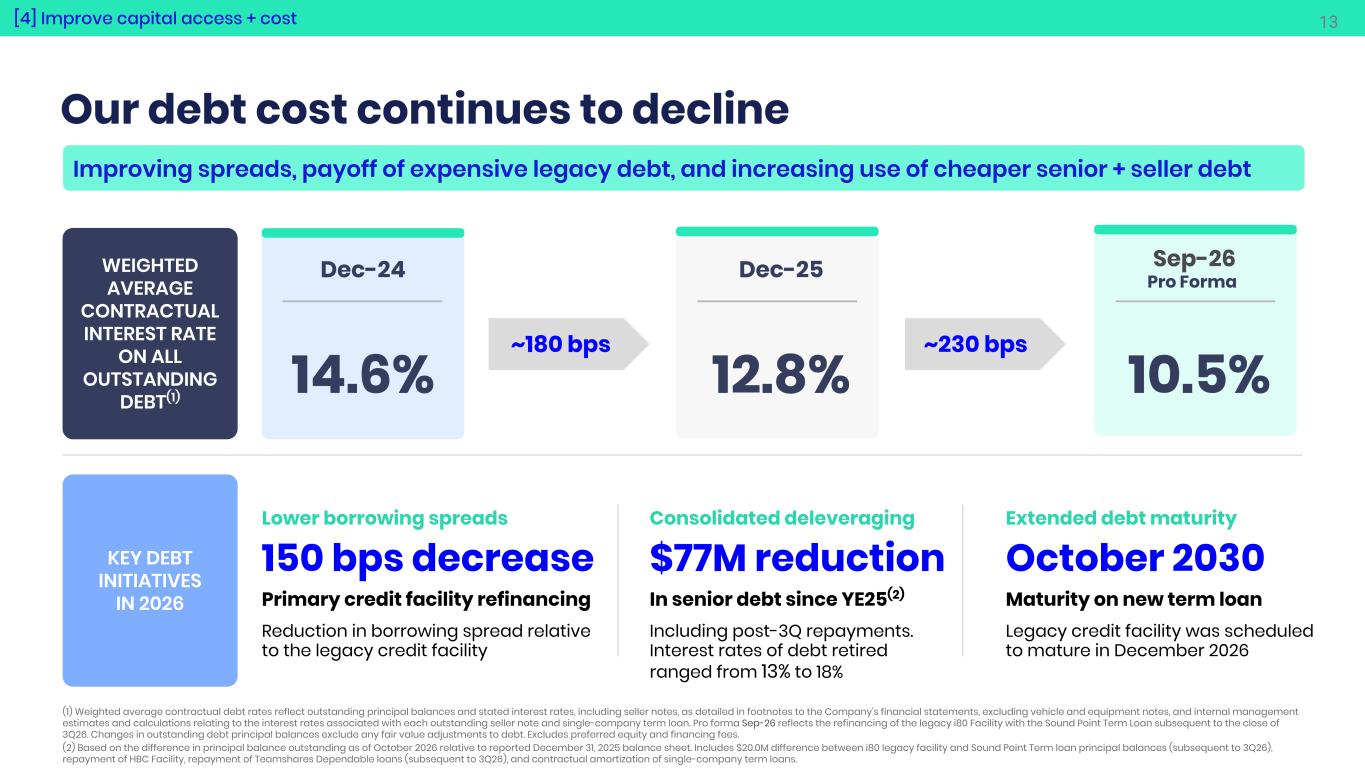
13 Consolidated deleveraging $77M reduction In senior debt since YE25(2) Including post-3Q repayments. Interest rates of debt retired ranged from 13% to 18% Our debt cost continues to decline [4] Improve capital access + cost Improving spreads, payoff of expensive legacy debt, and increasing use of cheaper senior + seller debt WEIGHTED AVERAGE CONTRACTUAL INTEREST RATE ON ALL OUTSTANDING DEBT(1) Dec-24 14.6% ~180 bps Lower borrowing spreads 150 bps decrease Primary credit facility refinancing Reduction in borrowing spread relative to the legacy credit facility Extended debt maturity October 2030 Maturity on new term loan Legacy credit facility was scheduled to mature in December 2026 (1) Weighted average contractual debt rates reflect outstanding principal balances and stated interest rates, including seller notes, as detailed in footnotes to the Company's financial statements, excluding vehicle and equipment notes, and internal management estimates and calculations relating to the interest rates associated with each outstanding seller note and single-company term loan. Pro forma Sep-26 reflects the refinancing of the legacy i80 Facility with the Sound Point Term Loan subsequent to the close of 3Q26. Changes in outstanding debt principal balances exclude any fair value adjustments to debt. Excludes preferred equity and financing fees. (2) Based on the difference in principal balance outstanding as of October 2026 relative to reported December 31, 2025 balance sheet. Includes $20.0M difference between i80 legacy facility and Sound Point Term loan principal balances (subsequent to 3Q26), repayment of HBC Facility, repayment of Teamshares Dependable loans (subsequent to 3Q26), and contractual amortization of single-company term loans. Dec-25 12.8% Sep-26 Pro Forma 10.5% ~230 bps KEY DEBT INITIATIVES IN 2026
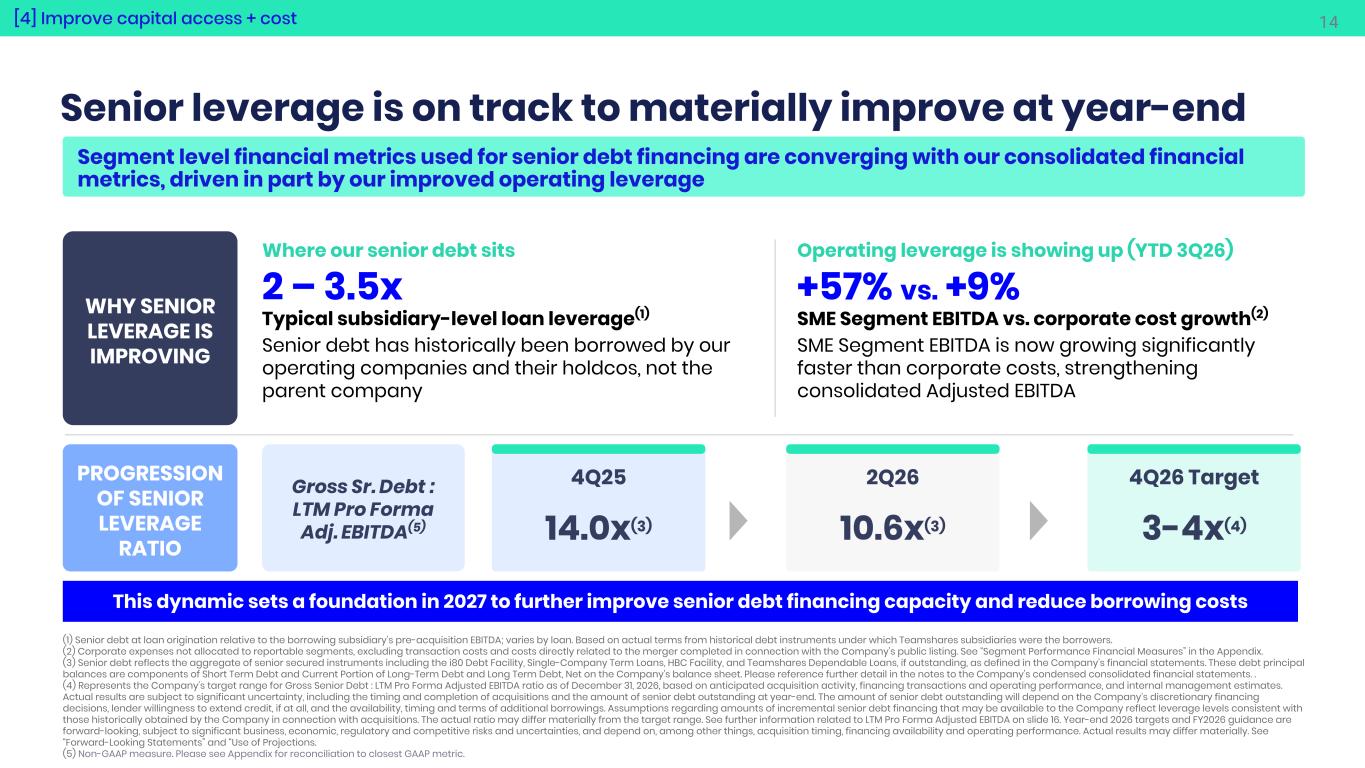
14 Senior leverage is on track to materially improve at year-end [4] Improve capital access + cost Segment level financial metrics used for senior debt financing are converging with our consolidated financial metrics, driven in part by our improved operating leverage WHY SENIOR LEVERAGE IS IMPROVING Where our senior debt sits 2 – 3.5x Typical subsidiary-level loan leverage(1) Senior debt has historically been borrowed by our operating companies and their holdcos, not the parent company Operating leverage is showing up (YTD 3Q26) +57% vs. +9% SME Segment EBITDA vs. corporate cost growth(2) SME Segment EBITDA is now growing significantly faster than corporate costs, strengthening consolidated Adjusted EBITDA PROGRESSION OF SENIOR LEVERAGE RATIO Gross Sr. Debt : LTM Pro Forma Adj. EBITDA(5) This dynamic sets a foundation in 2027 to further improve senior debt financing capacity and reduce borrowing costs (1) Senior debt at loan origination relative to the borrowing subsidiary’s pre-acquisition EBITDA; varies by loan. Based on actual terms from historical debt instruments under which Teamshares subsidiaries were the borrowers. (2) Corporate expenses not allocated to reportable segments, excluding transaction costs and costs directly related to the merger completed in connection with the Company’s public listing. See “Segment Performance Financial Measures” in the Appendix. (3) Senior debt reflects the aggregate of senior secured instruments including the i80 Debt Facility, Single-Company Term Loans, HBC Facility, and Teamshares Dependable Loans, if outstanding, as defined in the Company’s financial statements. These debt principal balances are components of Short Term Debt and Current Portion of Long-Term Debt and Long Term Debt, Net on the Company's balance sheet. Please reference further detail in the notes to the Company's condensed consolidated financial statements. . (4) Represents the Company’s target range for Gross Senior Debt : LTM Pro Forma Adjusted EBITDA ratio as of December 31, 2026, based on anticipated acquisition activity, financing transactions and operating performance, and internal management estimates. Actual results are subject to significant uncertainty, including the timing and completion of acquisitions and the amount of senior debt outstanding at year-end. The amount of senior debt outstanding will depend on the Company’s discretionary financing decisions, lender willingness to extend credit, if at all, and the availability, timing and terms of additional borrowings. Assumptions regarding amounts of incremental senior debt financing that may be available to the Company reflect leverage levels consistent with those historically obtained by the Company in connection with acquisitions. The actual ratio may differ materially from the target range. See further information related to LTM Pro Forma Adjusted EBITDA on slide 16. Year-end 2026 targets and FY2026 guidance are forward-looking, subject to significant business, economic, regulatory and competitive risks and uncertainties, and depend on, among other things, acquisition timing, financing availability and operating performance. Actual results may differ materially. See “Forward-Looking Statements” and “Use of Projections. (5) Non-GAAP measure. Please see Appendix for reconciliation to closest GAAP metric. 4Q25 14.0x(3) 2Q26 10.6x(3) 4Q26 Target 3-4x(4)
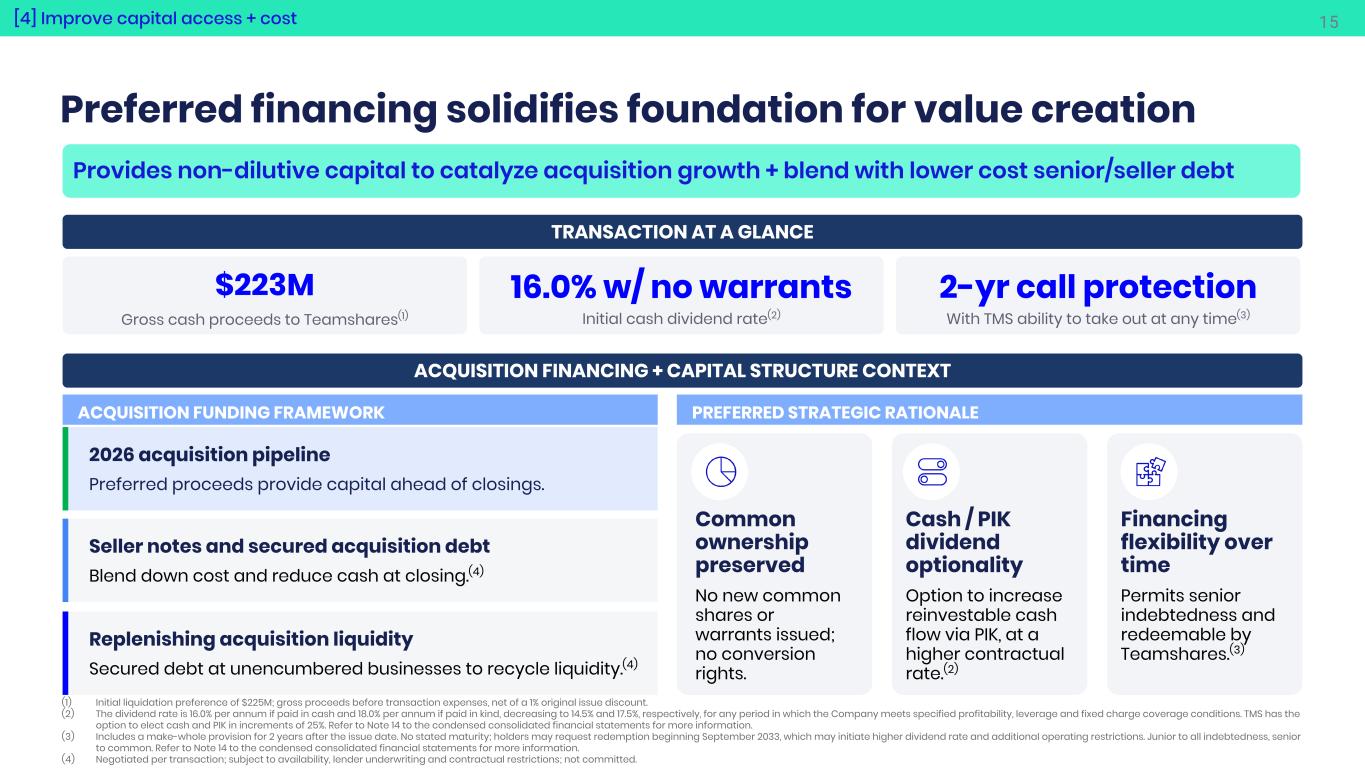
15 Preferred financing solidifies foundation for value creation [4] Improve capital access + cost Provides non-dilutive capital to catalyze acquisition growth + blend with lower cost senior/seller debt TRANSACTION AT A GLANCE $223M Gross cash proceeds to Teamshares(1) 16.0% w/ no warrants Initial cash dividend rate(2) 2-yr call protection With TMS ability to take out at any time(3) ACQUISITION FINANCING + CAPITAL STRUCTURE CONTEXT ACQUISITION FUNDING FRAMEWORK PREFERRED STRATEGIC RATIONALE (1) Initial liquidation preference of $225M; gross proceeds before transaction expenses, net of a 1% original issue discount. (2) The dividend rate is 16.0% per annum if paid in cash and 18.0% per annum if paid in kind, decreasing to 14.5% and 17.5%, respectively, for any period in which the Company meets specified profitability, leverage and fixed charge coverage conditions. TMS has the option to elect cash and PIK in increments of 25%. Refer to Note 14 to the condensed consolidated financial statements for more information. (3) Includes a make-whole provision for 2 years after the issue date. No stated maturity; holders may request redemption beginning September 2033, which may initiate higher dividend rate and additional operating restrictions. Junior to all indebtedness, senior to common. Refer to Note 14 to the condensed consolidated financial statements for more information. (4) Negotiated per transaction; subject to availability, lender underwriting and contractual restrictions; not committed. 2026 acquisition pipeline Preferred proceeds provide capital ahead of closings. Seller notes and secured acquisition debt Blend down cost and reduce cash at closing.(4) Replenishing acquisition liquidity Secured debt at unencumbered businesses to recycle liquidity.(4) Common ownership preserved No new common shares or warrants issued; no conversion rights. Cash / PIK dividend optionality Option to increase reinvestable cash flow via PIK, at a higher contractual rate.(2) Financing flexibility over time Permits senior indebtedness and redeemable by Teamshares.(3)
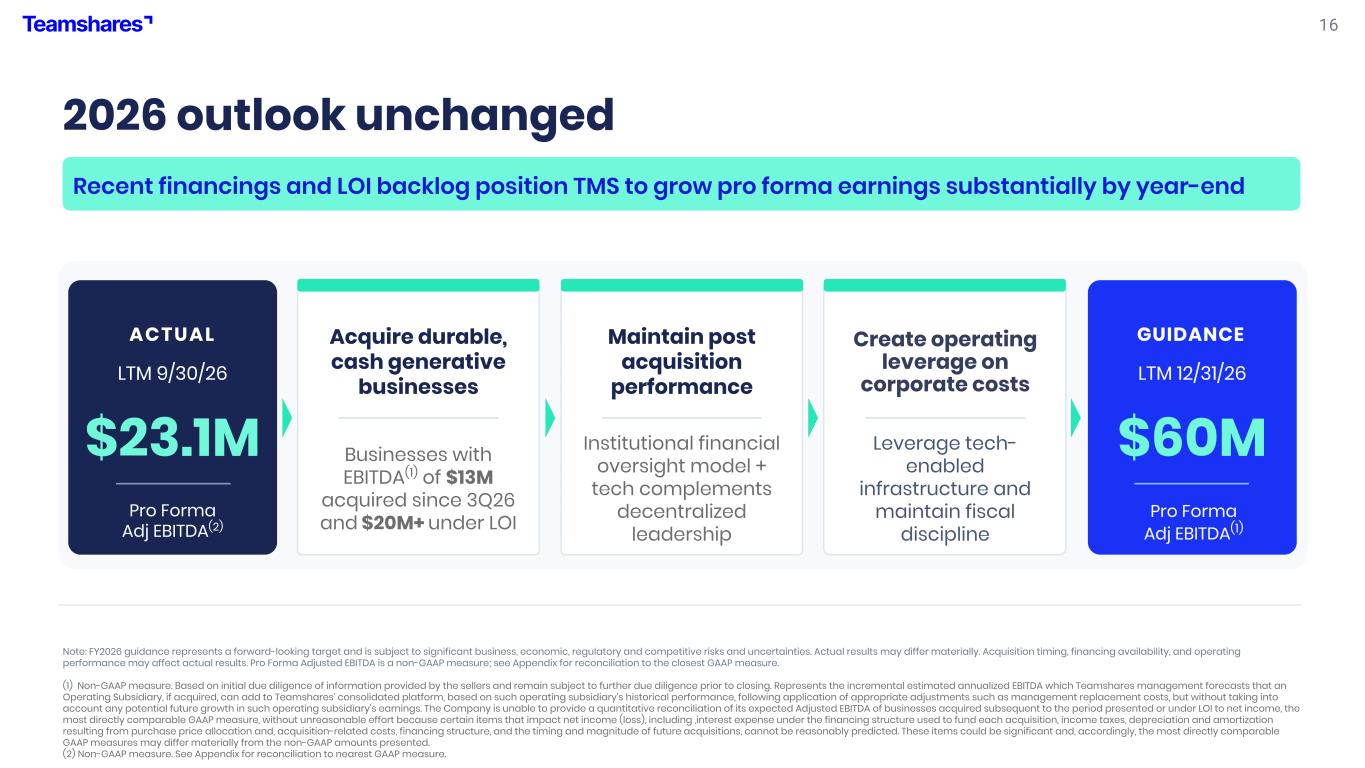
16 2026 outlook unchanged ACTUAL LTM 9/30/26 $23.1M Pro Forma Adj EBITDA(2) GUIDANCE LTM 12/31/26 $60M Pro Forma Adj EBITDA(1) Acquire durable, cash generative businesses Businesses with EBITDA(1) of $13M acquired since 3Q26 and $20M+ under LOI Maintain post acquisition performance Institutional financial oversight model + tech complements decentralized leadership Create operating leverage on corporate costs Leverage tech- enabled infrastructure and maintain fiscal discipline Note: FY2026 guidance represents a forward-looking target and is subject to significant business, economic, regulatory and competitive risks and uncertainties. Actual results may differ materially. Acquisition timing, financing availability, and operating performance may affect actual results. Pro Forma Adjusted EBITDA is a non-GAAP measure; see Appendix for reconciliation to the closest GAAP measure. (1) Non-GAAP measure. Based on initial due diligence of information provided by the sellers and remain subject to further due diligence prior to closing. Represents the incremental estimated annualized EBITDA which Teamshares management forecasts that an Operating Subsidiary, if acquired, can add to Teamshares’ consolidated platform, based on such operating subsidiary’s historical performance, following application of appropriate adjustments such as management replacement costs, but without taking into account any potential future growth in such operating subsidiary’s earnings. The Company is unable to provide a quantitative reconciliation of its expected Adjusted EBITDA of businesses acquired subsequent to the period presented or under LOI to net income, the most directly comparable GAAP measure, without unreasonable effort because certain items that impact net income (loss), including ,interest expense under the financing structure used to fund each acquisition, income taxes, depreciation and amortization resulting from purchase price allocation and, acquisition-related costs, financing structure, and the timing and magnitude of future acquisitions, cannot be reasonably predicted. These items could be significant and, accordingly, the most directly comparable GAAP measures may differ materially from the non-GAAP amounts presented. (2) Non-GAAP measure. See Appendix for reconciliation to nearest GAAP measure. Recent financings and LOI backlog position TMS to grow pro forma earnings substantially by year-end
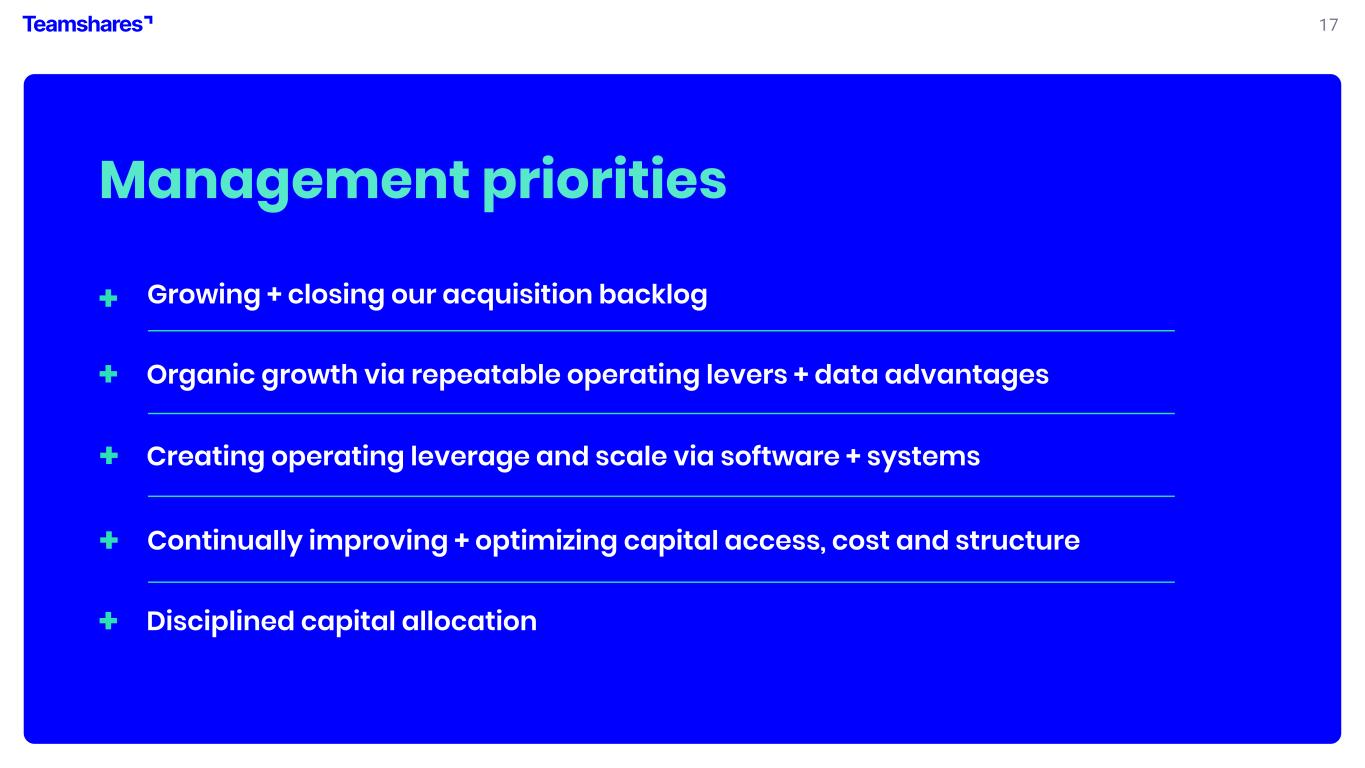
17 Management priorities + + Creating operating leverage and scale via software + systems + Organic growth via repeatable operating levers + data advantages + Growing + closing our acquisition backlog + Continually improving + optimizing capital access, cost and structure Disciplined capital allocation
18 Appendix
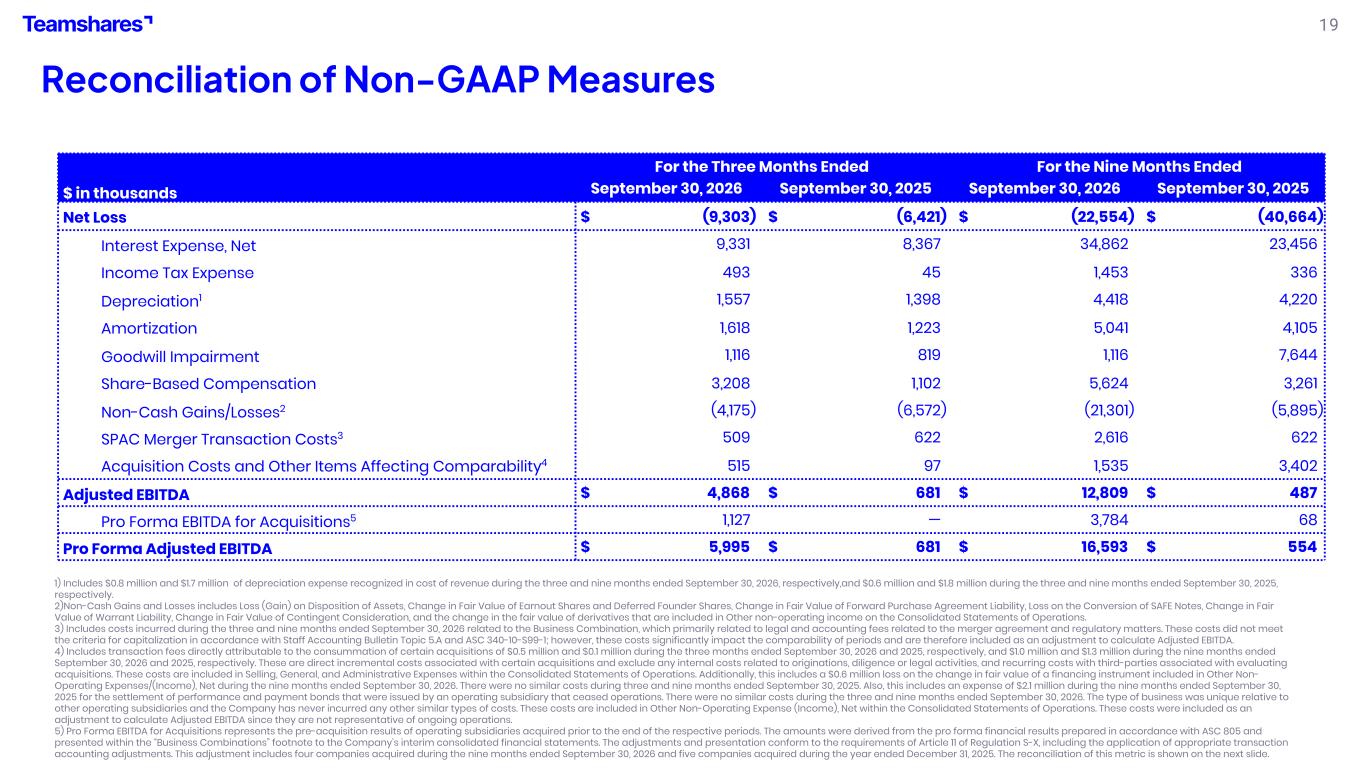
19 Reconciliation of Non-GAAP Measures 1) Includes $0.8 million and $1.7 million of depreciation expense recognized in cost of revenue during the three and nine months ended September 30, 2026, respectively,and $0.6 million and $1.8 million during the three and nine months ended September 30, 2025, respectively. 2)Non-Cash Gains and Losses includes Loss (Gain) on Disposition of Assets, Change in Fair Value of Earnout Shares and Deferred Founder Shares, Change in Fair Value of Forward Purchase Agreement Liability, Loss on the Conversion of SAFE Notes, Change in Fair Value of Warrant Liability, Change in Fair Value of Contingent Consideration, and the change in the fair value of derivatives that are included in Other non-operating income on the Consolidated Statements of Operations. 3) Includes costs incurred during the three and nine months ended September 30, 2026 related to the Business Combination, which primarily related to legal and accounting fees related to the merger agreement and regulatory matters. These costs did not meet the criteria for capitalization in accordance with Staff Accounting Bulletin Topic 5.A and ASC 340-10-S99-1; however, these costs significantly impact the comparability of periods and are therefore included as an adjustment to calculate Adjusted EBITDA. 4) Includes transaction fees directly attributable to the consummation of certain acquisitions of $0.5 million and $0.1 million during the three months ended September 30, 2026 and 2025, respectively, and $1.0 million and $1.3 million during the nine months ended September 30, 2026 and 2025, respectively. These are direct incremental costs associated with certain acquisitions and exclude any internal costs related to originations, diligence or legal activities, and recurring costs with third-parties associated with evaluating acquisitions. These costs are included in Selling, General, and Administrative Expenses within the Consolidated Statements of Operations. Additionally, this includes a $0.6 million loss on the change in fair value of a financing instrument included in Other Non- Operating Expenses/(Income), Net during the nine months ended September 30, 2026. There were no similar costs during three and nine months ended September 30, 2025. Also, this includes an expense of $2.1 million during the nine months ended September 30, 2025 for the settlement of performance and payment bonds that were issued by an operating subsidiary that ceased operations. There were no similar costs during the three and nine months ended September 30, 2026. The type of business was unique relative to other operating subsidiaries and the Company has never incurred any other similar types of costs. These costs are included in Other Non-Operating Expense (Income), Net within the Consolidated Statements of Operations. These costs were included as an adjustment to calculate Adjusted EBITDA since they are not representative of ongoing operations. 5) Pro Forma EBITDA for Acquisitions represents the pre-acquisition results of operating subsidiaries acquired prior to the end of the respective periods. The amounts were derived from the pro forma financial results prepared in accordance with ASC 805 and presented within the “Business Combinations” footnote to the Company’s interim consolidated financial statements. The adjustments and presentation conform to the requirements of Article 11 of Regulation S-X, including the application of appropriate transaction accounting adjustments. This adjustment includes four companies acquired during the nine months ended September 30, 2026 and five companies acquired during the year ended December 31, 2025. The reconciliation of this metric is shown on the next slide. For the Three Months Ended For the Nine Months Ended $ in thousands September 30, 2026 September 30, 2025 September 30, 2026 September 30, 2025 Net Loss $ (9,303) $ (6,421) $ (22,554) $ (40,664) Interest Expense, Net 9,331 8,367 34,862 23,456 Income Tax Expense 493 45 1,453 336 Depreciation1 1,557 1,398 4,418 4,220 Amortization 1,618 1,223 5,041 4,105 Goodwill Impairment 1,116 819 1,116 7,644 Share-Based Compensation 3,208 1,102 5,624 3,261 Non-Cash Gains/Losses2 (4,175) (6,572) (21,301) (5,895) SPAC Merger Transaction Costs3 509 622 2,616 622 Acquisition Costs and Other Items Affecting Comparability4 515 97 1,535 3,402 Adjusted EBITDA $ 4,868 $ 681 $ 12,809 $ 487 Pro Forma EBITDA for Acquisitions5 1,127 — 3,784 68 Pro Forma Adjusted EBITDA $ 5,995 $ 681 $ 16,593 $ 554
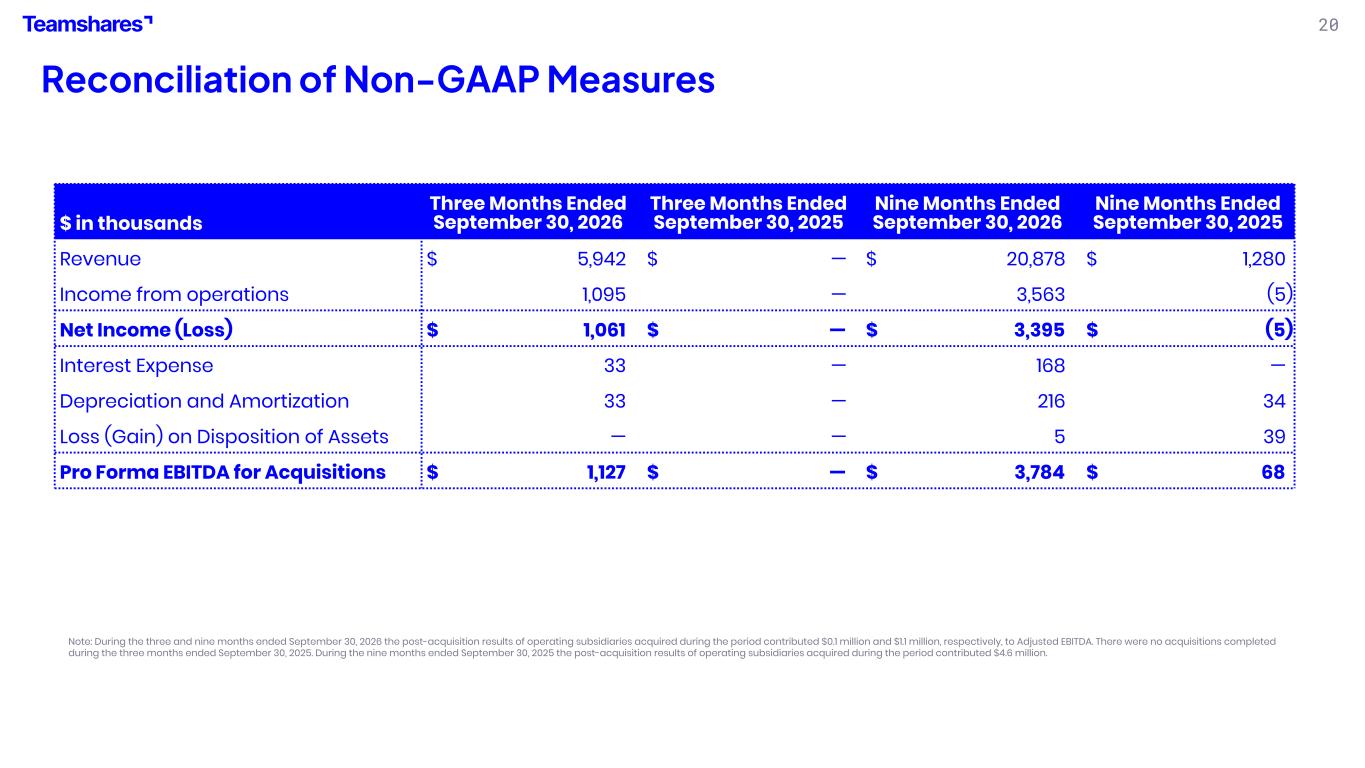
20 Reconciliation of Non-GAAP Measures Note: During the three and nine months ended September 30, 2026 the post-acquisition results of operating subsidiaries acquired during the period contributed $0.1 million and $1.1 million, respectively, to Adjusted EBITDA. There were no acquisitions completed during the three months ended September 30, 2025. During the nine months ended September 30, 2025 the post-acquisition results of operating subsidiaries acquired during the period contributed $4.6 million. $ in thousands Three Months Ended September 30, 2026 Three Months Ended September 30, 2025 Nine Months Ended September 30, 2026 Nine Months Ended September 30, 2025 Revenue $ 5,942 $ — $ 20,878 $ 1,280 Income from operations 1,095 — 3,563 (5) Net Income (Loss) $ 1,061 $ — $ 3,395 $ (5) Interest Expense 33 — 168 — Depreciation and Amortization 33 — 216 34 Loss (Gain) on Disposition of Assets — — 5 39 Pro Forma EBITDA for Acquisitions $ 1,127 $ — $ 3,784 $ 68
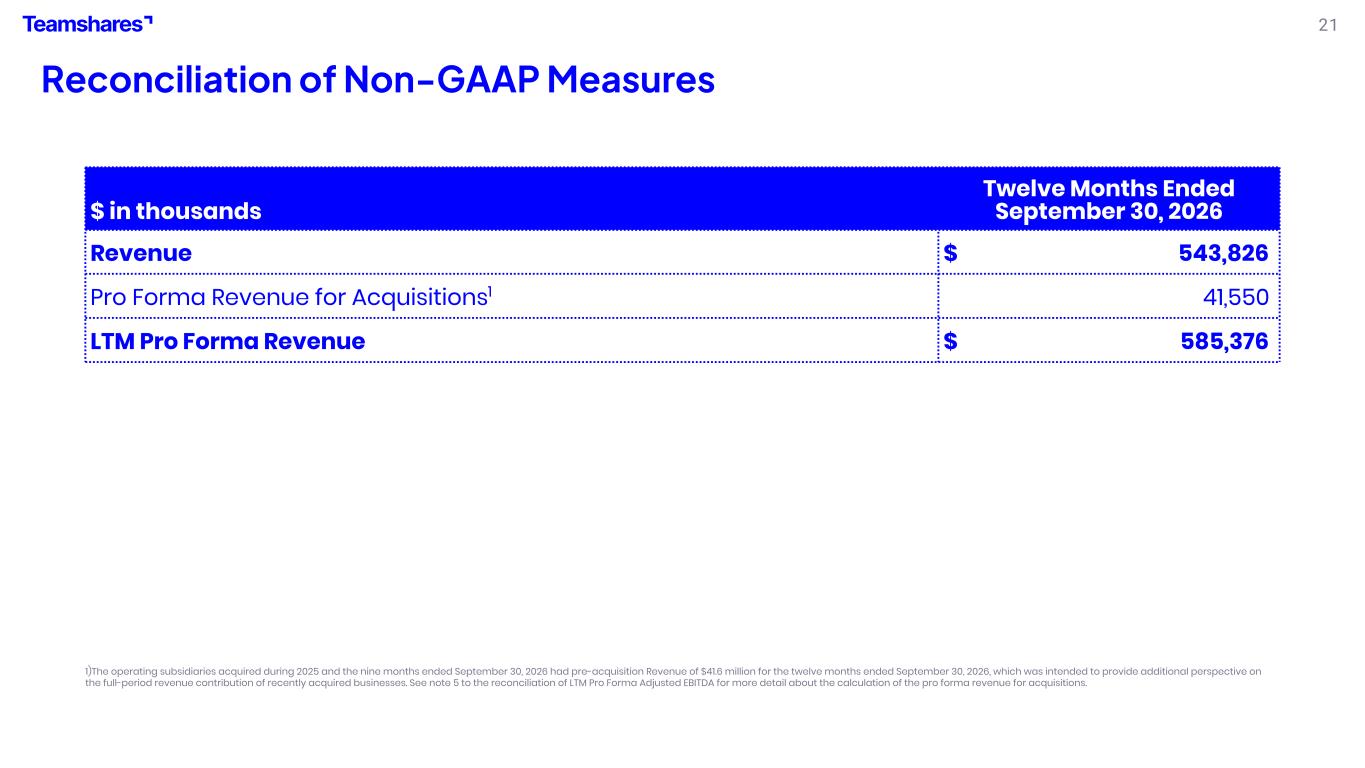
21 Reconciliation of Non-GAAP Measures 1)The operating subsidiaries acquired during 2025 and the nine months ended September 30, 2026 had pre-acquisition Revenue of $41.6 million for the twelve months ended September 30, 2026, which was intended to provide additional perspective on the full-period revenue contribution of recently acquired businesses. See note 5 to the reconciliation of LTM Pro Forma Adjusted EBITDA for more detail about the calculation of the pro forma revenue for acquisitions. $ in thousands Twelve Months Ended September 30, 2026 Revenue $ 543,826 Pro Forma Revenue for Acquisitions1 41,550 LTM Pro Forma Revenue $ 585,376
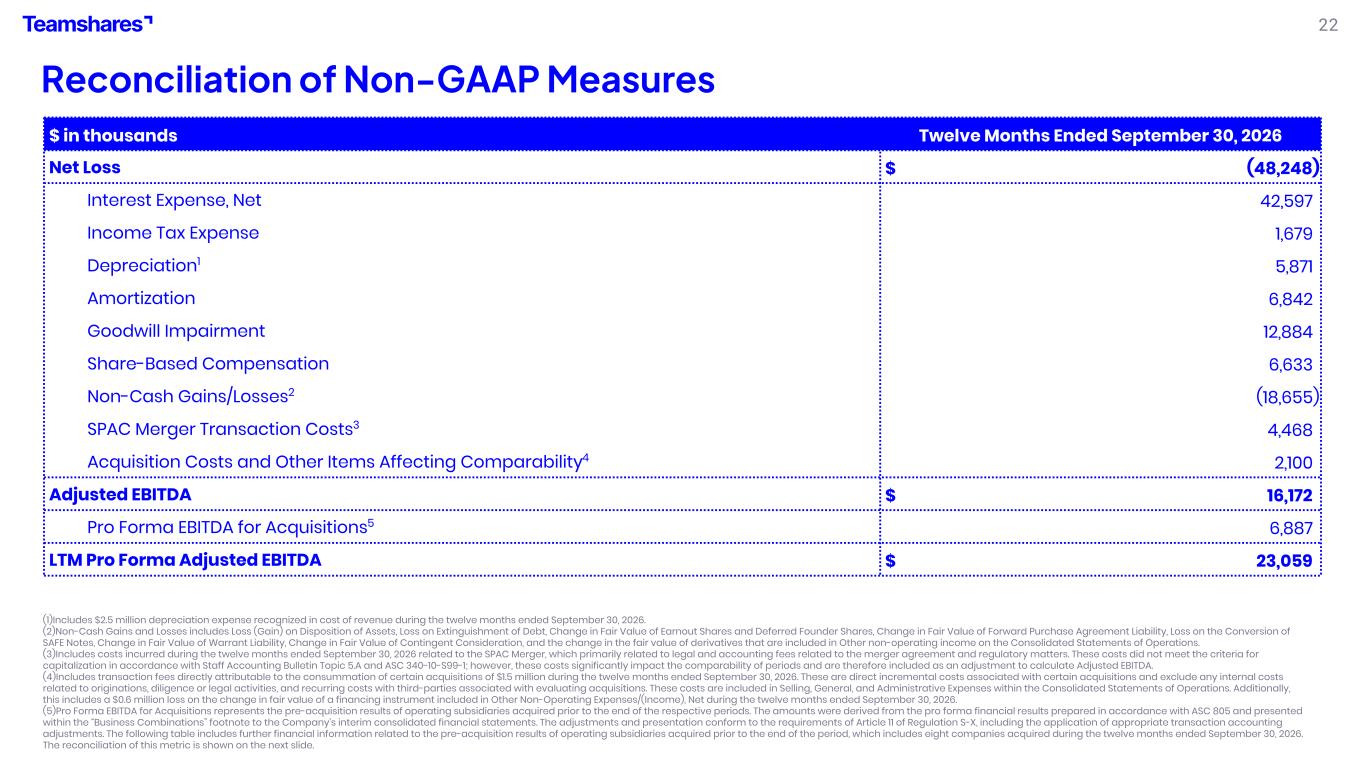
22 Reconciliation of Non-GAAP Measures (1)Includes $2.5 million depreciation expense recognized in cost of revenue during the twelve months ended September 30, 2026. (2)Non-Cash Gains and Losses includes Loss (Gain) on Disposition of Assets, Loss on Extinguishment of Debt, Change in Fair Value of Earnout Shares and Deferred Founder Shares, Change in Fair Value of Forward Purchase Agreement Liability, Loss on the Conversion of SAFE Notes, Change in Fair Value of Warrant Liability, Change in Fair Value of Contingent Consideration, and the change in the fair value of derivatives that are included in Other non-operating income on the Consolidated Statements of Operations. (3)Includes costs incurred during the twelve months ended September 30, 2026 related to the SPAC Merger, which primarily related to legal and accounting fees related to the merger agreement and regulatory matters. These costs did not meet the criteria for capitalization in accordance with Staff Accounting Bulletin Topic 5.A and ASC 340-10-S99-1; however, these costs significantly impact the comparability of periods and are therefore included as an adjustment to calculate Adjusted EBITDA. (4)Includes transaction fees directly attributable to the consummation of certain acquisitions of $1.5 million during the twelve months ended September 30, 2026. These are direct incremental costs associated with certain acquisitions and exclude any internal costs related to originations, diligence or legal activities, and recurring costs with third-parties associated with evaluating acquisitions. These costs are included in Selling, General, and Administrative Expenses within the Consolidated Statements of Operations. Additionally, this includes a $0.6 million loss on the change in fair value of a financing instrument included in Other Non-Operating Expenses/(Income), Net during the twelve months ended September 30, 2026. (5)Pro Forma EBITDA for Acquisitions represents the pre-acquisition results of operating subsidiaries acquired prior to the end of the respective periods. The amounts were derived from the pro forma financial results prepared in accordance with ASC 805 and presented within the “Business Combinations” footnote to the Company’s interim consolidated financial statements. The adjustments and presentation conform to the requirements of Article 11 of Regulation S-X, including the application of appropriate transaction accounting adjustments. The following table includes further financial information related to the pre-acquisition results of operating subsidiaries acquired prior to the end of the period, which includes eight companies acquired during the twelve months ended September 30, 2026. The reconciliation of this metric is shown on the next slide. $ in thousands Twelve Months Ended September 30, 2026 Net Loss $ (48,248) Interest Expense, Net 42,597 Income Tax Expense 1,679 Depreciation1 5,871 Amortization 6,842 Goodwill Impairment 12,884 Share-Based Compensation 6,633 Non-Cash Gains/Losses2 (18,655) SPAC Merger Transaction Costs3 4,468 Acquisition Costs and Other Items Affecting Comparability4 2,100 Adjusted EBITDA $ 16,172 Pro Forma EBITDA for Acquisitions5 6,887 LTM Pro Forma Adjusted EBITDA $ 23,059
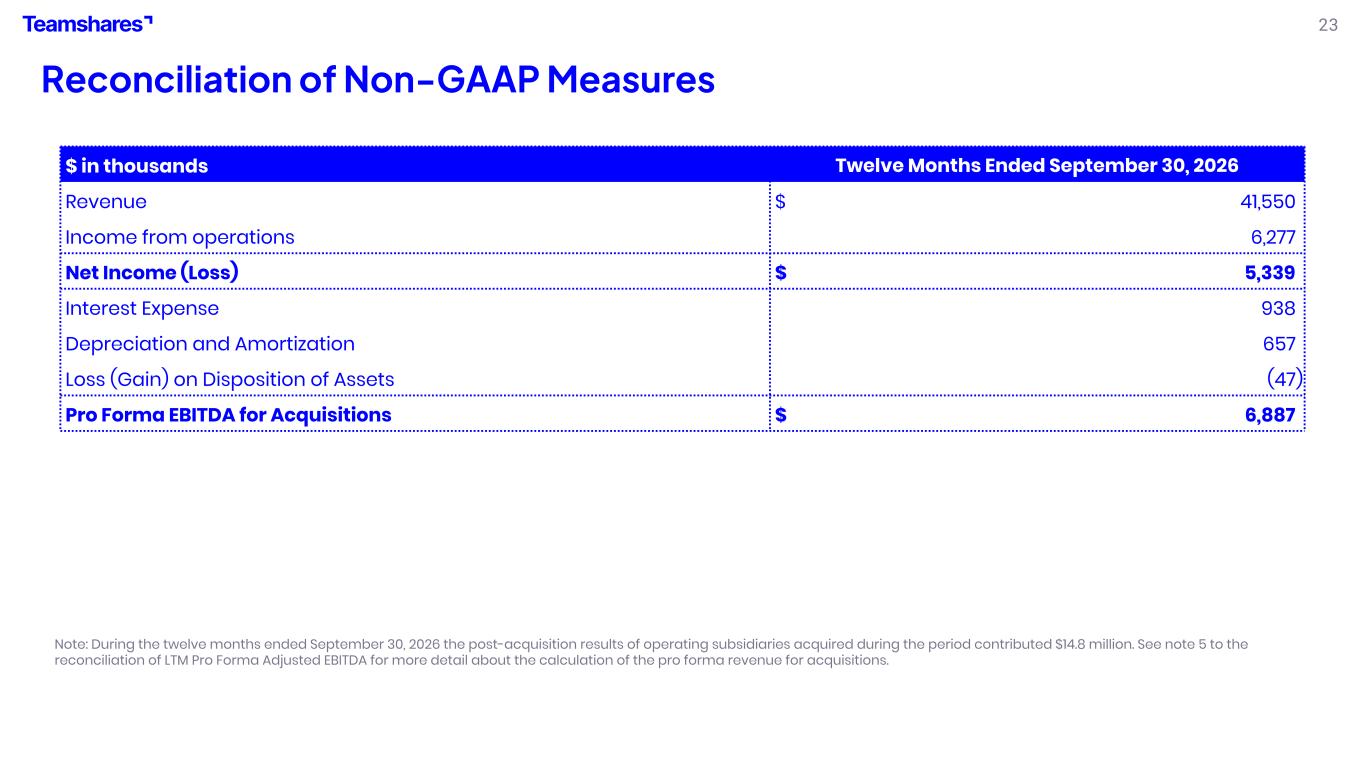
23 Reconciliation of Non-GAAP Measures Note: During the twelve months ended September 30, 2026 the post-acquisition results of operating subsidiaries acquired during the period contributed $14.8 million. See note 5 to the reconciliation of LTM Pro Forma Adjusted EBITDA for more detail about the calculation of the pro forma revenue for acquisitions. $ in thousands Twelve Months Ended September 30, 2026 Revenue $ 41,550 Income from operations 6,277 Net Income (Loss) $ 5,339 Interest Expense 938 Depreciation and Amortization 657 Loss (Gain) on Disposition of Assets (47) Pro Forma EBITDA for Acquisitions $ 6,887
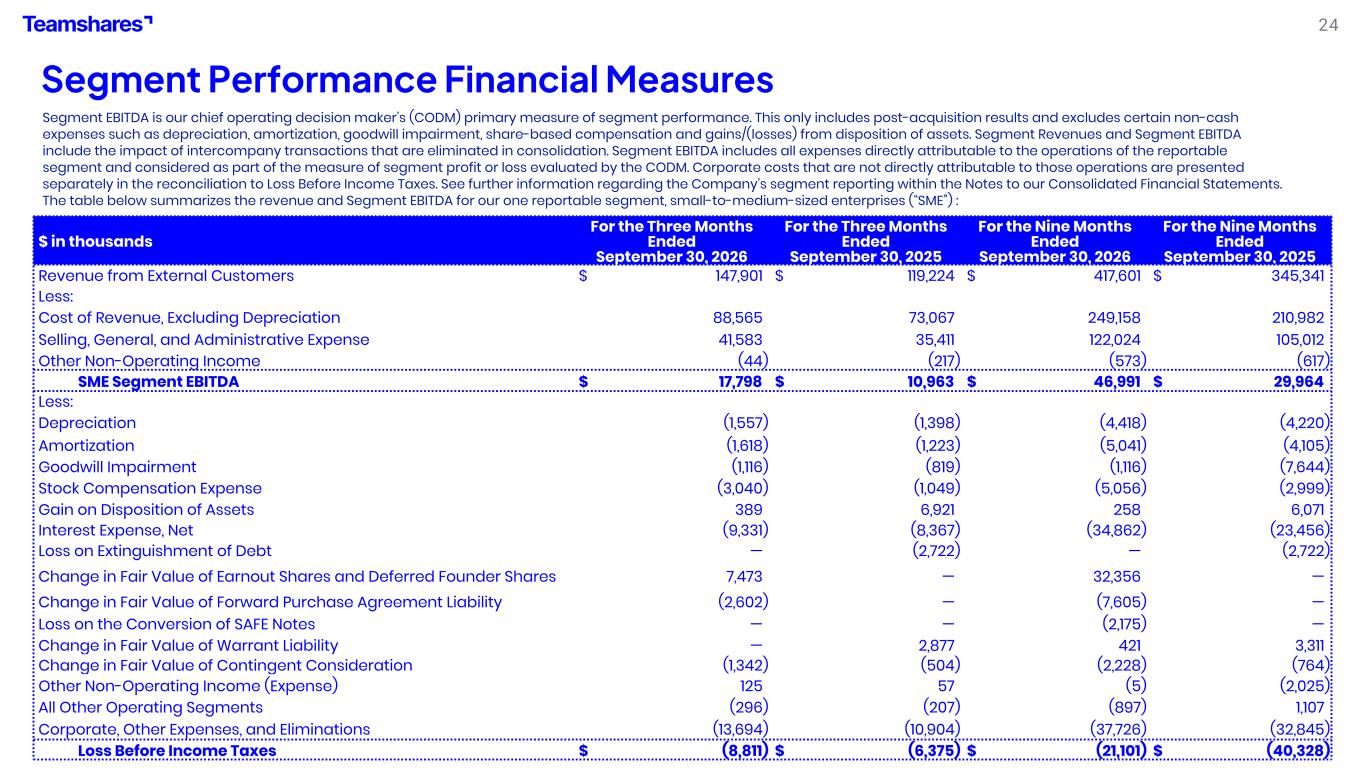
24 Segment Performance Financial Measures Segment EBITDA is our chief operating decision maker’s (CODM) primary measure of segment performance. This only includes post-acquisition results and excludes certain non-cash expenses such as depreciation, amortization, goodwill impairment, share-based compensation and gains/(losses) from disposition of assets. Segment Revenues and Segment EBITDA include the impact of intercompany transactions that are eliminated in consolidation. Segment EBITDA includes all expenses directly attributable to the operations of the reportable segment and considered as part of the measure of segment profit or loss evaluated by the CODM. Corporate costs that are not directly attributable to those operations are presented separately in the reconciliation to Loss Before Income Taxes. See further information regarding the Company’s segment reporting within the Notes to our Consolidated Financial Statements. The table below summarizes the revenue and Segment EBITDA for our one reportable segment, small-to-medium-sized enterprises (“SME”) : $ in thousands For the Three Months Ended September 30, 2026 For the Three Months Ended September 30, 2025 For the Nine Months Ended September 30, 2026 For the Nine Months Ended September 30, 2025 Revenue from External Customers $ 147,901 $ 119,224 $ 417,601 $ 345,341 Less: Cost of Revenue, Excluding Depreciation 88,565 73,067 249,158 210,982 Selling, General, and Administrative Expense 41,583 35,411 122,024 105,012 Other Non-Operating Income (44) (217) (573) (617) SME Segment EBITDA $ 17,798 $ 10,963 $ 46,991 $ 29,964 Less: Depreciation (1,557) (1,398) (4,418) (4,220) Amortization (1,618) (1,223) (5,041) (4,105) Goodwill Impairment (1,116) (819) (1,116) (7,644) Stock Compensation Expense (3,040) (1,049) (5,056) (2,999) Gain on Disposition of Assets 389 6,921 258 6,071 Interest Expense, Net (9,331) (8,367) (34,862) (23,456) Loss on Extinguishment of Debt — (2,722) — (2,722) Change in Fair Value of Earnout Shares and Deferred Founder Shares 7,473 — 32,356 — Change in Fair Value of Forward Purchase Agreement Liability (2,602) — (7,605) — Loss on the Conversion of SAFE Notes — — (2,175) — Change in Fair Value of Warrant Liability — 2,877 421 3,311 Change in Fair Value of Contingent Consideration (1,342) (504) (2,228) (764) Other Non-Operating Income (Expense) 125 57 (5) (2,025) All Other Operating Segments (296) (207) (897) 1,107 Corporate, Other Expenses, and Eliminations (13,694) (10,904) (37,726) (32,845) Loss Before Income Taxes $ (8,811) $ (6,375) $ (21,101) $ (40,328)
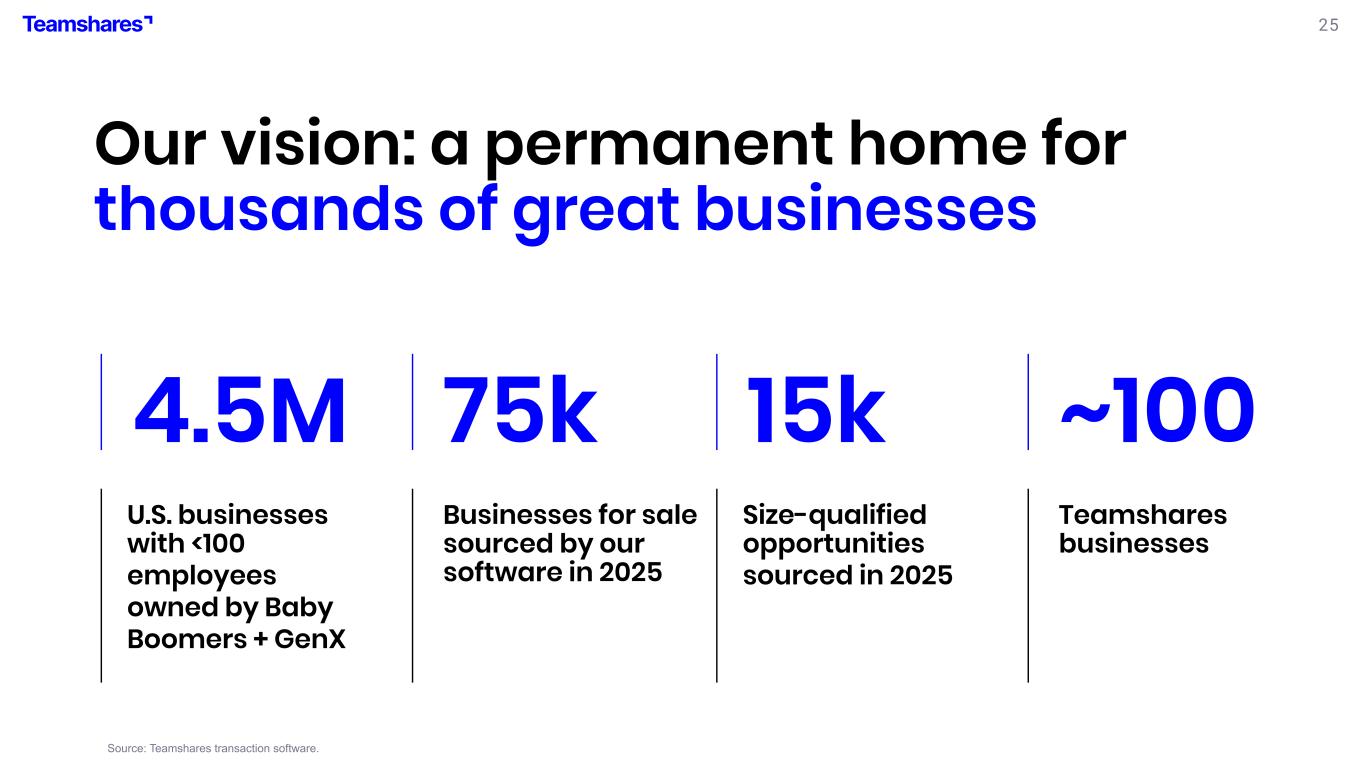
25 4.5M U.S. businesses with <100 employees owned by Baby Boomers + GenX Our vision: a permanent home for thousands of great businesses 75k Businesses for sale sourced by our software in 2025 Source: Teamshares transaction software. 15k Size-qualified opportunities sourced in 2025 ~100 Teamshares businesses
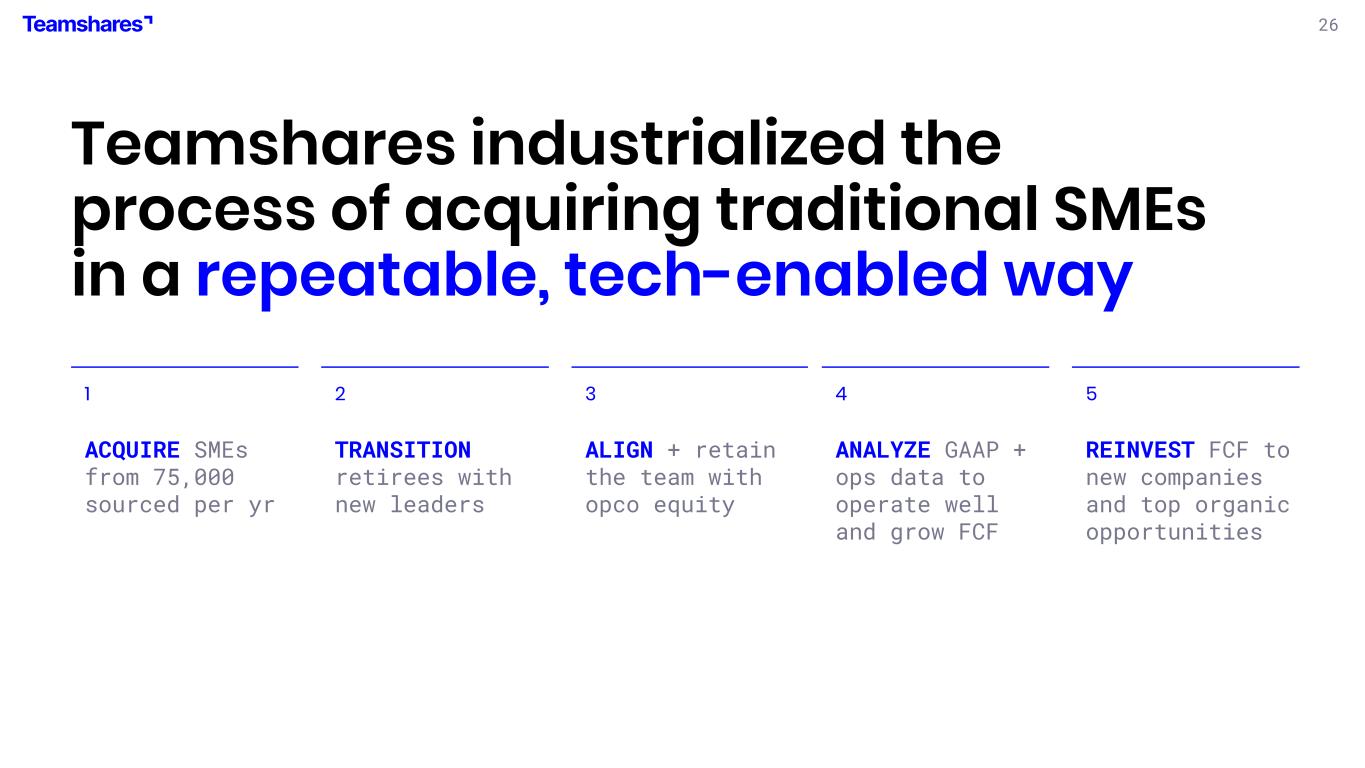
26 Teamshares industrialized the process of acquiring traditional SMEs in a repeatable, tech-enabled way 1 ACQUIRE SMEs from 75,000 sourced per yr 2 TRANSITION retirees with new leaders 3 ALIGN + retain the team with opco equity 4 ANALYZE GAAP + ops data to operate well and grow FCF 5 REINVEST FCF to new companies and top organic opportunities
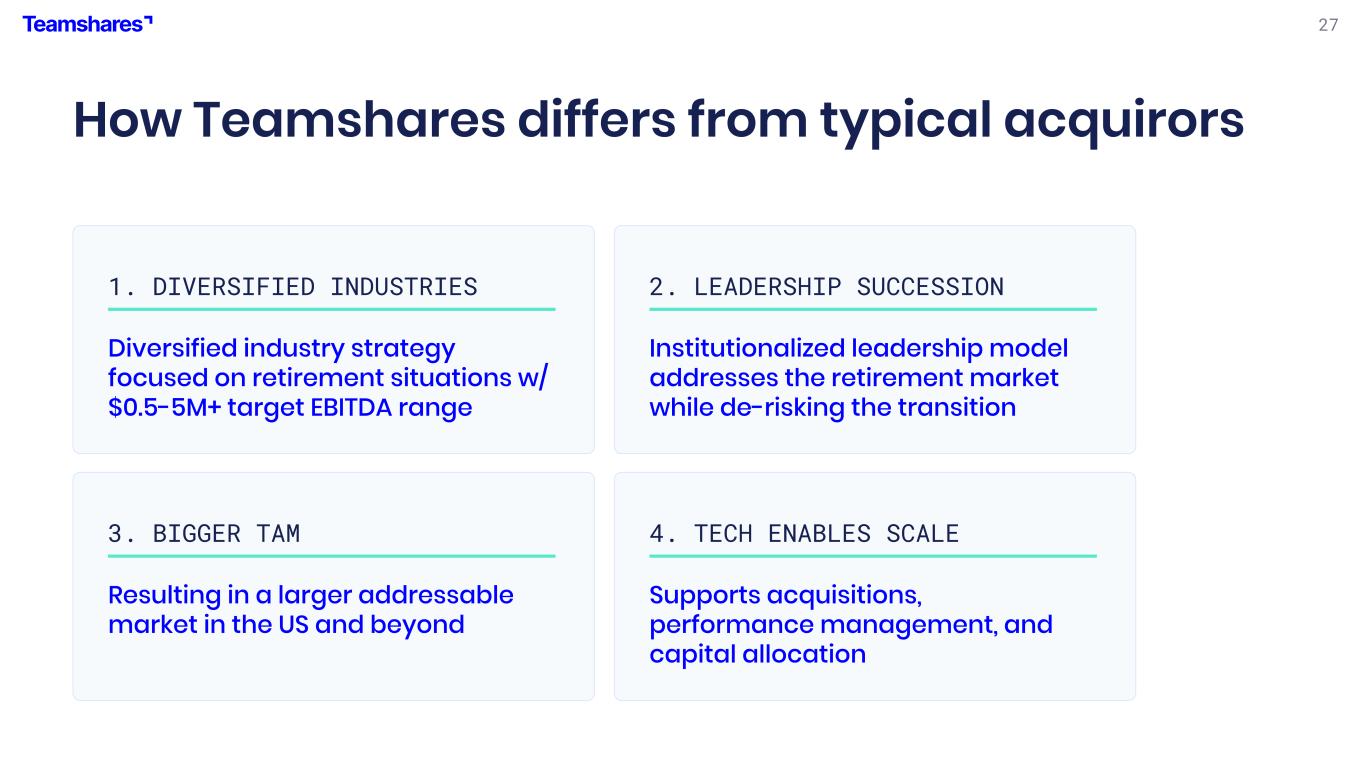
27 How Teamshares differs from typical acquirors 1. DIVERSIFIED INDUSTRIES Diversified industry strategy focused on retirement situations w/ $0.5-5M+ target EBITDA range 2. LEADERSHIP SUCCESSION Institutionalized leadership model addresses the retirement market while de-risking the transition 3. BIGGER TAM Resulting in a larger addressable market in the US and beyond 4. TECH ENABLES SCALE Supports acquisitions, performance management, and capital allocation

28 It’s still Day One at